Traces
The agentgateway integrates with Jaeger as the tracing platform. Jaeger is an open source tool that helps you follow the path of a request as it is forwarded between agents. The chain of events and interactions are captured by an OpenTelemetry pipeline that is configured to send traces to the Jaeger agent. You can then visualize the traces by using the Jaeger UI.
Before you begin
- Make sure that you have
docker, such as by installing Docker Desktop. - Install the
agentgatewaybinary.
Set up Jaeger
Use docker compose to spin up a Jaeger instance with the following components:
- An OpenTelemetry collector that receives traces from the agentgateway. The collector is exposed on
http://localhost:4317. - A Jaeger agent that receives the collected traces. The agent is exposed on
http://localhost:14268. - A Jaeger UI that is exposed on
http://localhost:16686.
docker compose -f - up -d <<EOF
services:
  jaeger:
    container_name: jaeger
    restart: unless-stopped
    image: jaegertracing/all-in-one:latest
    ports:
    - "127.0.0.1:16686:16686"
    - "127.0.0.1:14268:14268"
    environment:
    - COLLECTOR_OTLP_ENABLED=true

  otel-collector:
    container_name: otel-collector
    image: otel/opentelemetry-collector-contrib:0.146.0
    volumes:
      - ./otel-collector-config.yaml:/etc/otelcol-contrib/config.yaml
    ports:
      - "127.0.0.1:4317:4317"
    depends_on:
      - jaeger

EOF
Tracing configuration types
Agentgateway supports two types of tracing configuration:
- Static tracing: Configured globally in the
config.tracingsection. All routes use the same tracing configuration. - Dynamic tracing: Configured at the frontend policy level (per-listener). All routes handled by a listener use the same tracing configuration from
frontendPolicies.tracing. This allows you to configure different tracing backends per listener, set dynamic span attributes and resource attributes using CEL expressions, override sampling rates per listener, or use different OTLP protocols (HTTP or gRPC) per listener.
Static tracing
Static tracing is configured globally and applies to all routes.
Download a telemetry configuration for your agentgateway.
curl -L https://agentgateway.dev/examples/telemetry/config.yaml -o config.yamlReview the configuration file.
cat config.yamlfrontendPolicies: tracing: host: localhost:4317 randomSampling: true binds: - port: 3000 listeners: - routes: - backends: - mcp: targets: - name: everything stdio: cmd: npx args: ["@modelcontextprotocol/server-everything"]- Listener: An HTTP listener that listens for incoming traffic on port 3000.
- Traces: The agentgateway is configured to send traces to the OpenTelemetry collector that you exposed on
http://localhost:4317. - Backend: The agentgateway targets a sample, open source MCP test server,
server-everything.
Optional: To use the agentgateway UI playground later, add the following CORS policy to your
config.yamlfile. The config automatically reloads when you save the file.binds: - port: 3000 listeners: - routes: - policies: cors: allowOrigins: - "*" allowHeaders: - "*" backends: ...Run the agentgateway.
agentgateway -f config.yaml
Dynamic tracing
Dynamic tracing allows you to configure tracing at the frontend policy level, providing per-listener control over tracing behavior. The tracing configuration applies to all routes handled by listeners that use the frontend policies. Each route can have its own tracing configuration with dynamic attributes, resources, and sampling rates.
attributes: Span-level attributes that are added to each individual trace span. They are evaluated as CEL expressions for each request, so you can use dynamic values likerequest.pathorjwt.sub. These appear as tags on individual spans in Jaeger.resources: Resource-level attributes that are set at the tracer provider level and apply to all spans from that tracer. Theservice.nameresource attribute sets the service name that appears in Jaeger’s service dropdown. If not set, it defaults to"agentgateway".remove: Attribute keys to remove before attributes are evaluated. This way, you can remove default attributes or avoid duplication.randomSamplingandclientSampling: Optional per-policy overrides for random and client sampling. If set, overrides global config for requests that use this frontend policy.
Basic dynamic tracing example
The following example shows how to configure dynamic tracing at the frontend policy level:
- Listener: An HTTP listener that listens for incoming traffic on port 3000.
- Traces: Agentgateway is configured with the following details:
- Sends traces to the OpenTelemetry collector on
localhost:4317with the gRPC protocol. - Sets the resource attributes for the service name to
agentgateway. - Sets the span attributes for the environment to
productionand the route to the request path. - Enables random sampling tracing. By default, sampling is set to false and disabled, which means no traces are generated.
- Sends traces to the OpenTelemetry collector on
- Policies: A CORS policy is configured to allow all origins and the
mcp-protocol-versionheader. This way, the configuration works with the MCP inspector tool. - Backend: Agentgateway targets a sample, open source MCP test server,
server-everything.
frontendPolicies:
  tracing:
    host: localhost:4317
    protocol: grpc
    randomSampling: "1.0"
    attributes:
      environment: '"production"'
      route: request.path
    resources:
      service.name: '"agentgateway"'
binds:
- port: 3000
  listeners:
  - routes:
    - policies:
        cors:
          allowOrigins:
            - "*"
          allowHeaders:
            - "*"
      backends:
      - mcp:
          targets:
          - name: everything
            stdio:
              cmd: npx
              args: ["@modelcontextprotocol/server-everything"]
Verify traces
Open the agentgateway UI to view your listener and target configuration.
Connect to the MCP server with the agentgateway UI playground.
From the navigation menu, click Playground.
In the Testing card, review your Connection details and click Connect. The agentgateway UI connects to the target that you configured and retrieves the tools that are exposed on the target.
Verify that you see a list of Available Tools.
Verify access to a tool.
From the Available Tools list, select the
echotool.In the message field, enter any string, such as
hello world, and click Run Tool.Verify that you see your message echoed in the Response card.
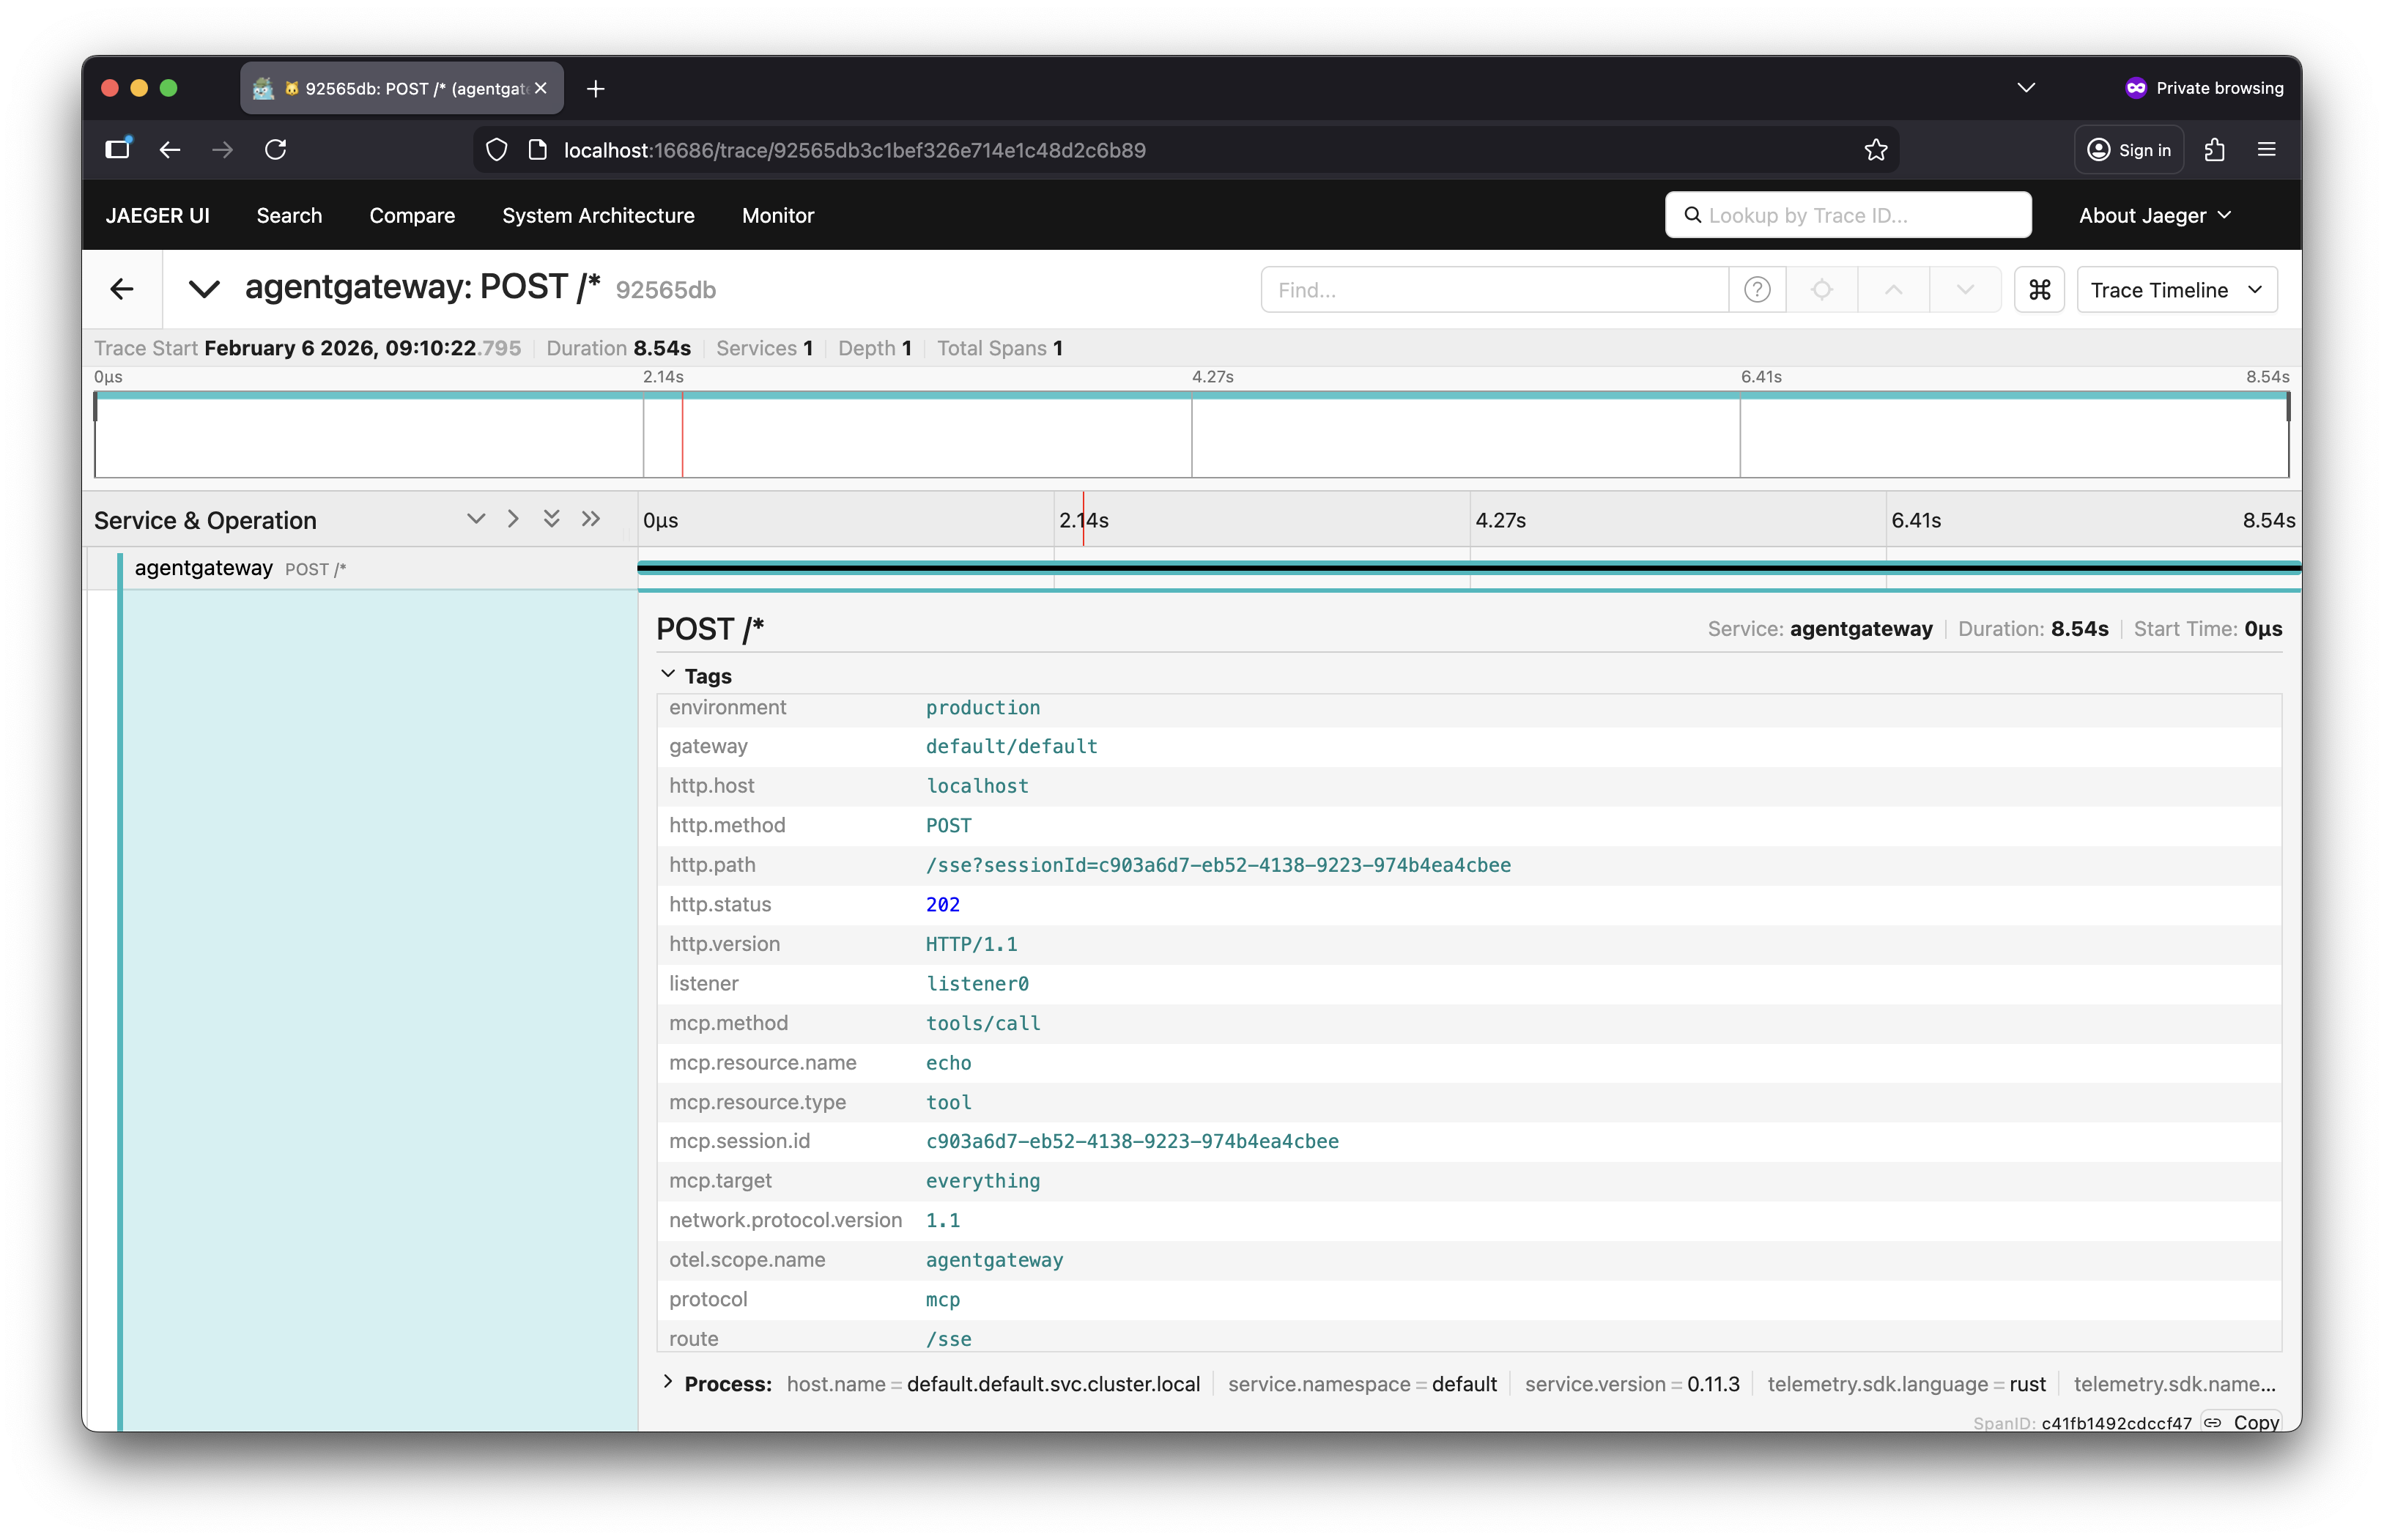
Open the Jaeger UI.
View traces.
- From the Service drop down, select the service name you configured, such as
agentgateway. - Click Find Traces.
- Verify that you can see trace spans for listing the MCP tools (
list_tools) and calling a tool (call_tool).
Expand a trace to review the details of the trace.
- From the Service drop down, select the service name you configured, such as
Cleanup
Stop and remove the Jaeger container.
docker stop jaeger
docker rm jaeger