Traces
The Agent Gateway integrates with Jaeger as the tracing platform. Jaeger is an open source tool that helps you follow the path of a request as it is forwarded between agents. The chain of events and interactions are captured by an OpenTelemetry pipeline that is configured to send traces to the Jaeger agent. You can then visualize the traces by using the Jaeger UI.
Set up Jaeger
Use docker compose
to spin up a Jaeger instance with the following components:
- An OpenTelemetry collector that receives traces from the Agent Gateway. The collector is exposed on
http://localhost:4317
. - A Jaeger agent that receives the collected traces. The agent is exposed on
http://localhost:14268
. - A Jaeger UI that is exposed on
http://localhost:16686
.
docker compose -f - up -d <<EOF
services:
jaeger:
container_name: jaeger
restart: unless-stopped
image: jaegertracing/all-in-one:latest
ports:
- "127.0.0.1:16686:16686"
- "127.0.0.1:14268:14268"
- "127.0.0.1:4317:4317"
environment:
- COLLECTOR_OTLP_ENABLED=true
EOF
Configure the Agent Gateway
-
Create a configuration file for your Agent Gateway. In this example, you configure the following elements:
- Listener: An SSE listener that listens for incoming traffic on port 3000.
- Traces: The Agent Gateway is configured to send traces to the OpenTelemetry collector that you exposed on
http://localhost:4317
. - Target: The Agent Gateway targets a sample, open source MCP test server,
server-everything
.
cat <<EOF > ./config.json { "type": "static", "listeners": [ { "name": "sse", "protocol": "MCP", "sse": { "address": "[::]", "port": 3000 } } ], "tracing": { "tracer": { "otlp": { "endpoint": "http://localhost:4317" } } }, "targets": { "mcp": [ { "name": "everything", "stdio": { "cmd": "npx", "args": [ "@modelcontextprotocol/server-everything" ] } } ] } } EOF
-
Run the Agent Gateway.
agentgateway -f config.json
Verify traces
-
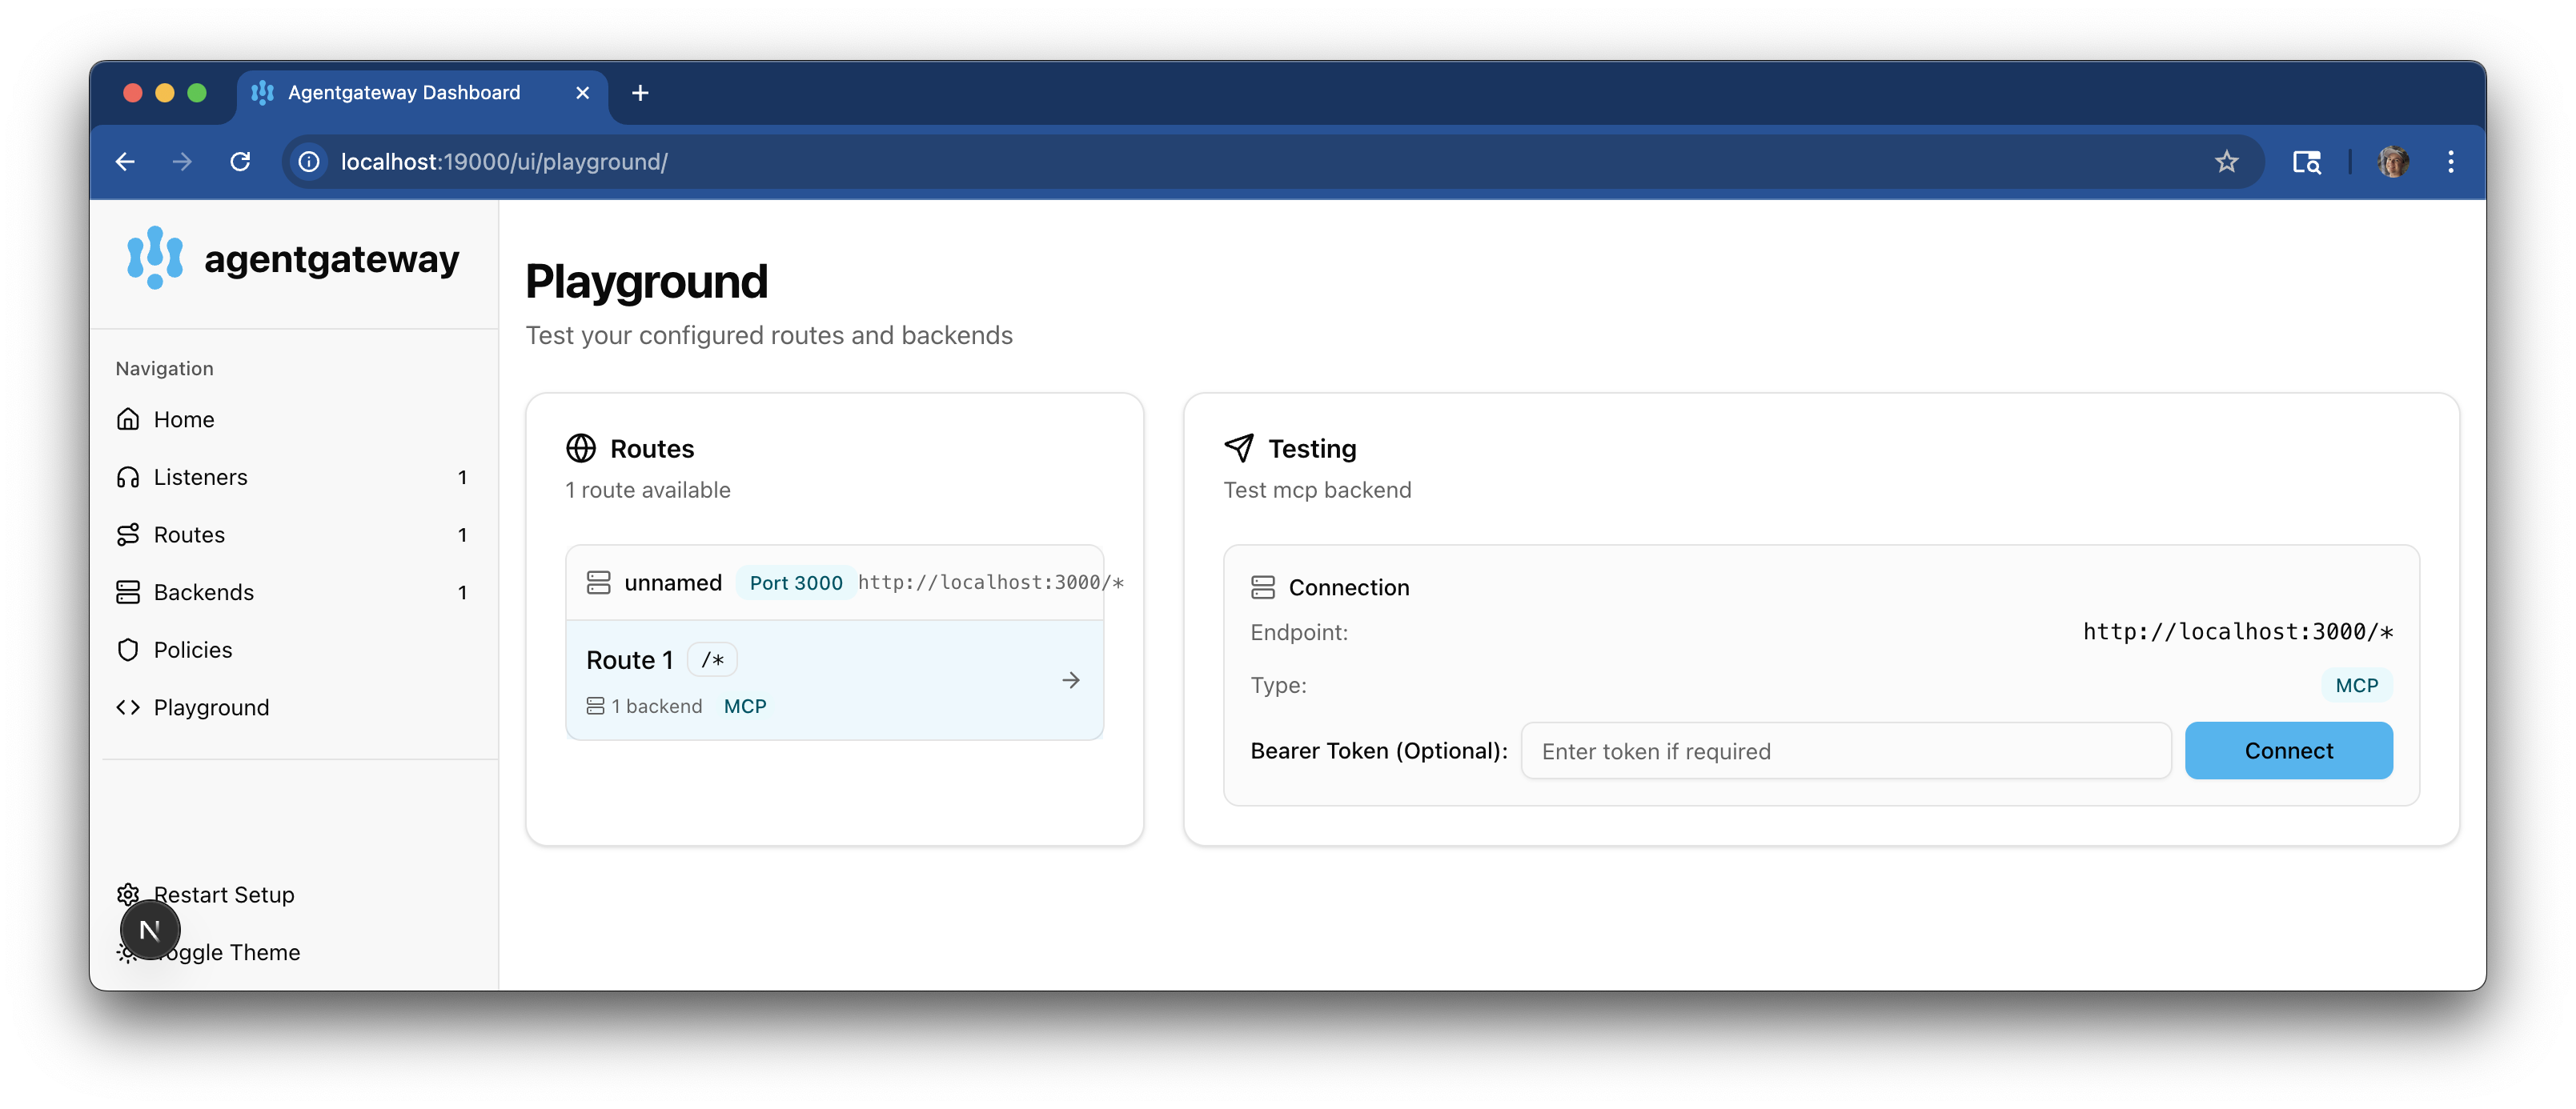
Open the Agent Gateway UI to view your listener and target configuration.
-
Connect to the MCP server with the Agent Gateway UI playground.
-
Go to the Agent Gateway UI Playground.
-
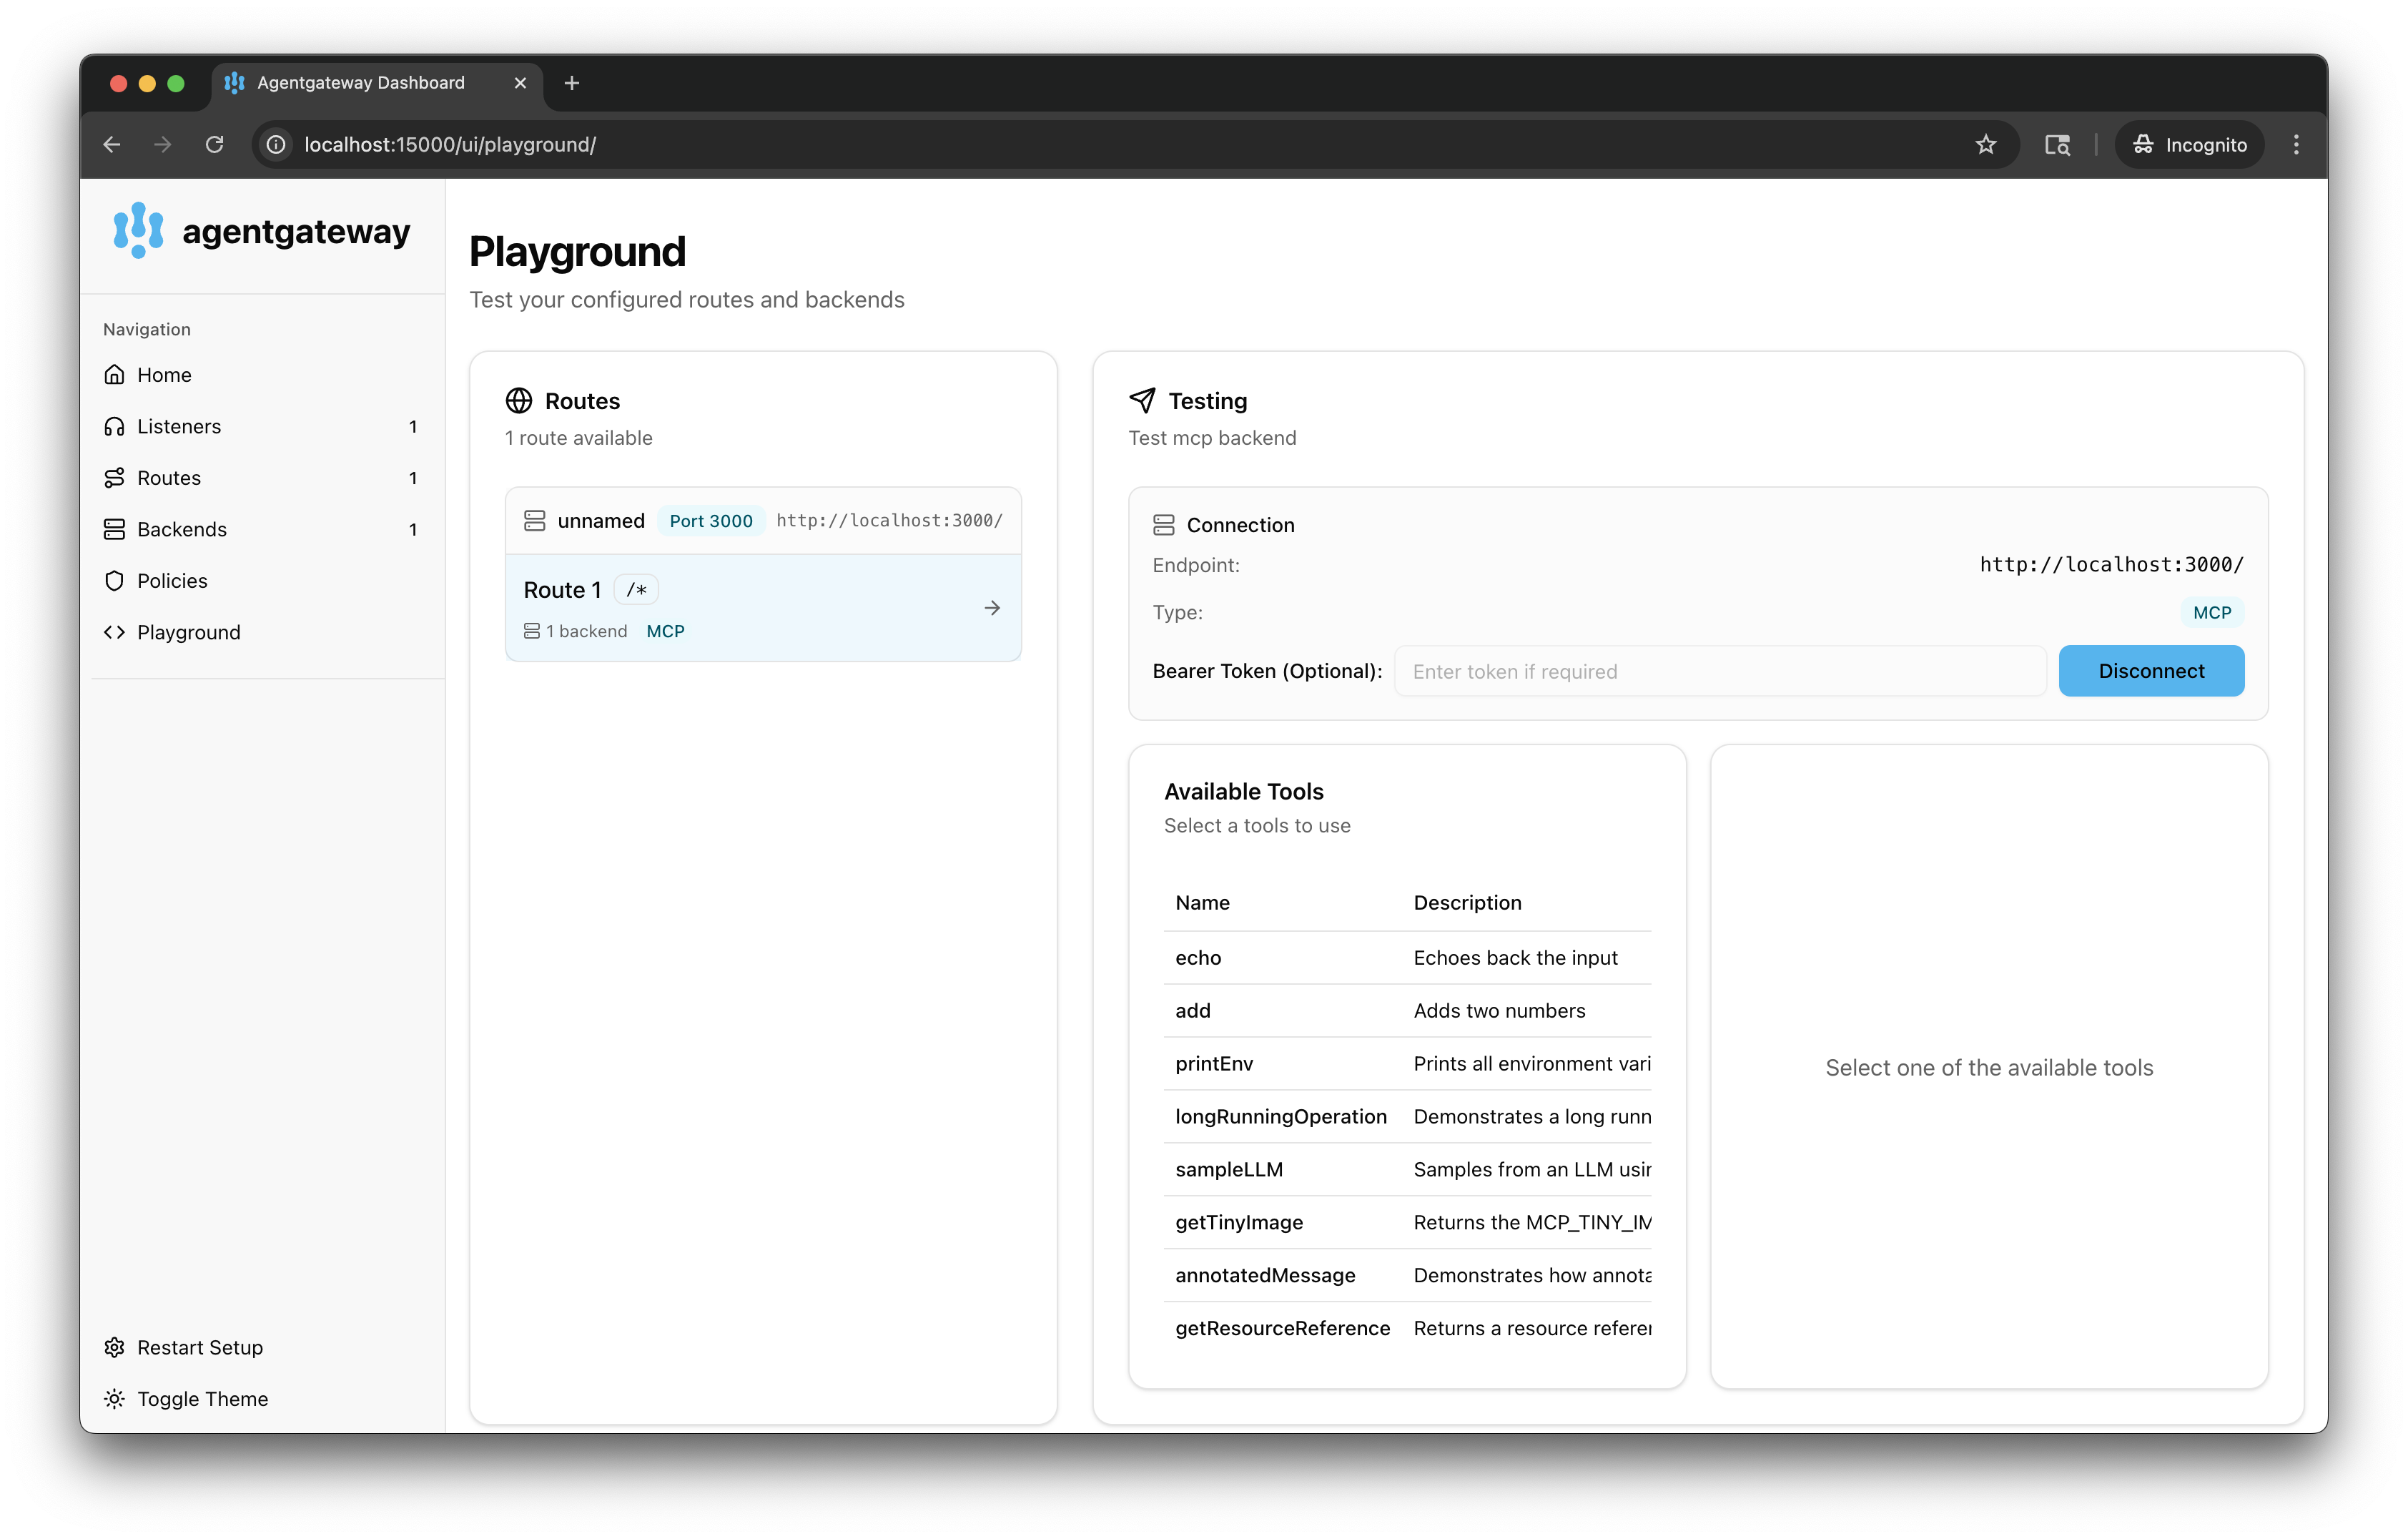
In the Connection Settings card, select your Listener Endpoint and click Connect. The Agent Gateway UI connects to the target that you configured and retrieves the tools that are exposed on the target.
-
Verify that you see a list of Available Tools.
-
-
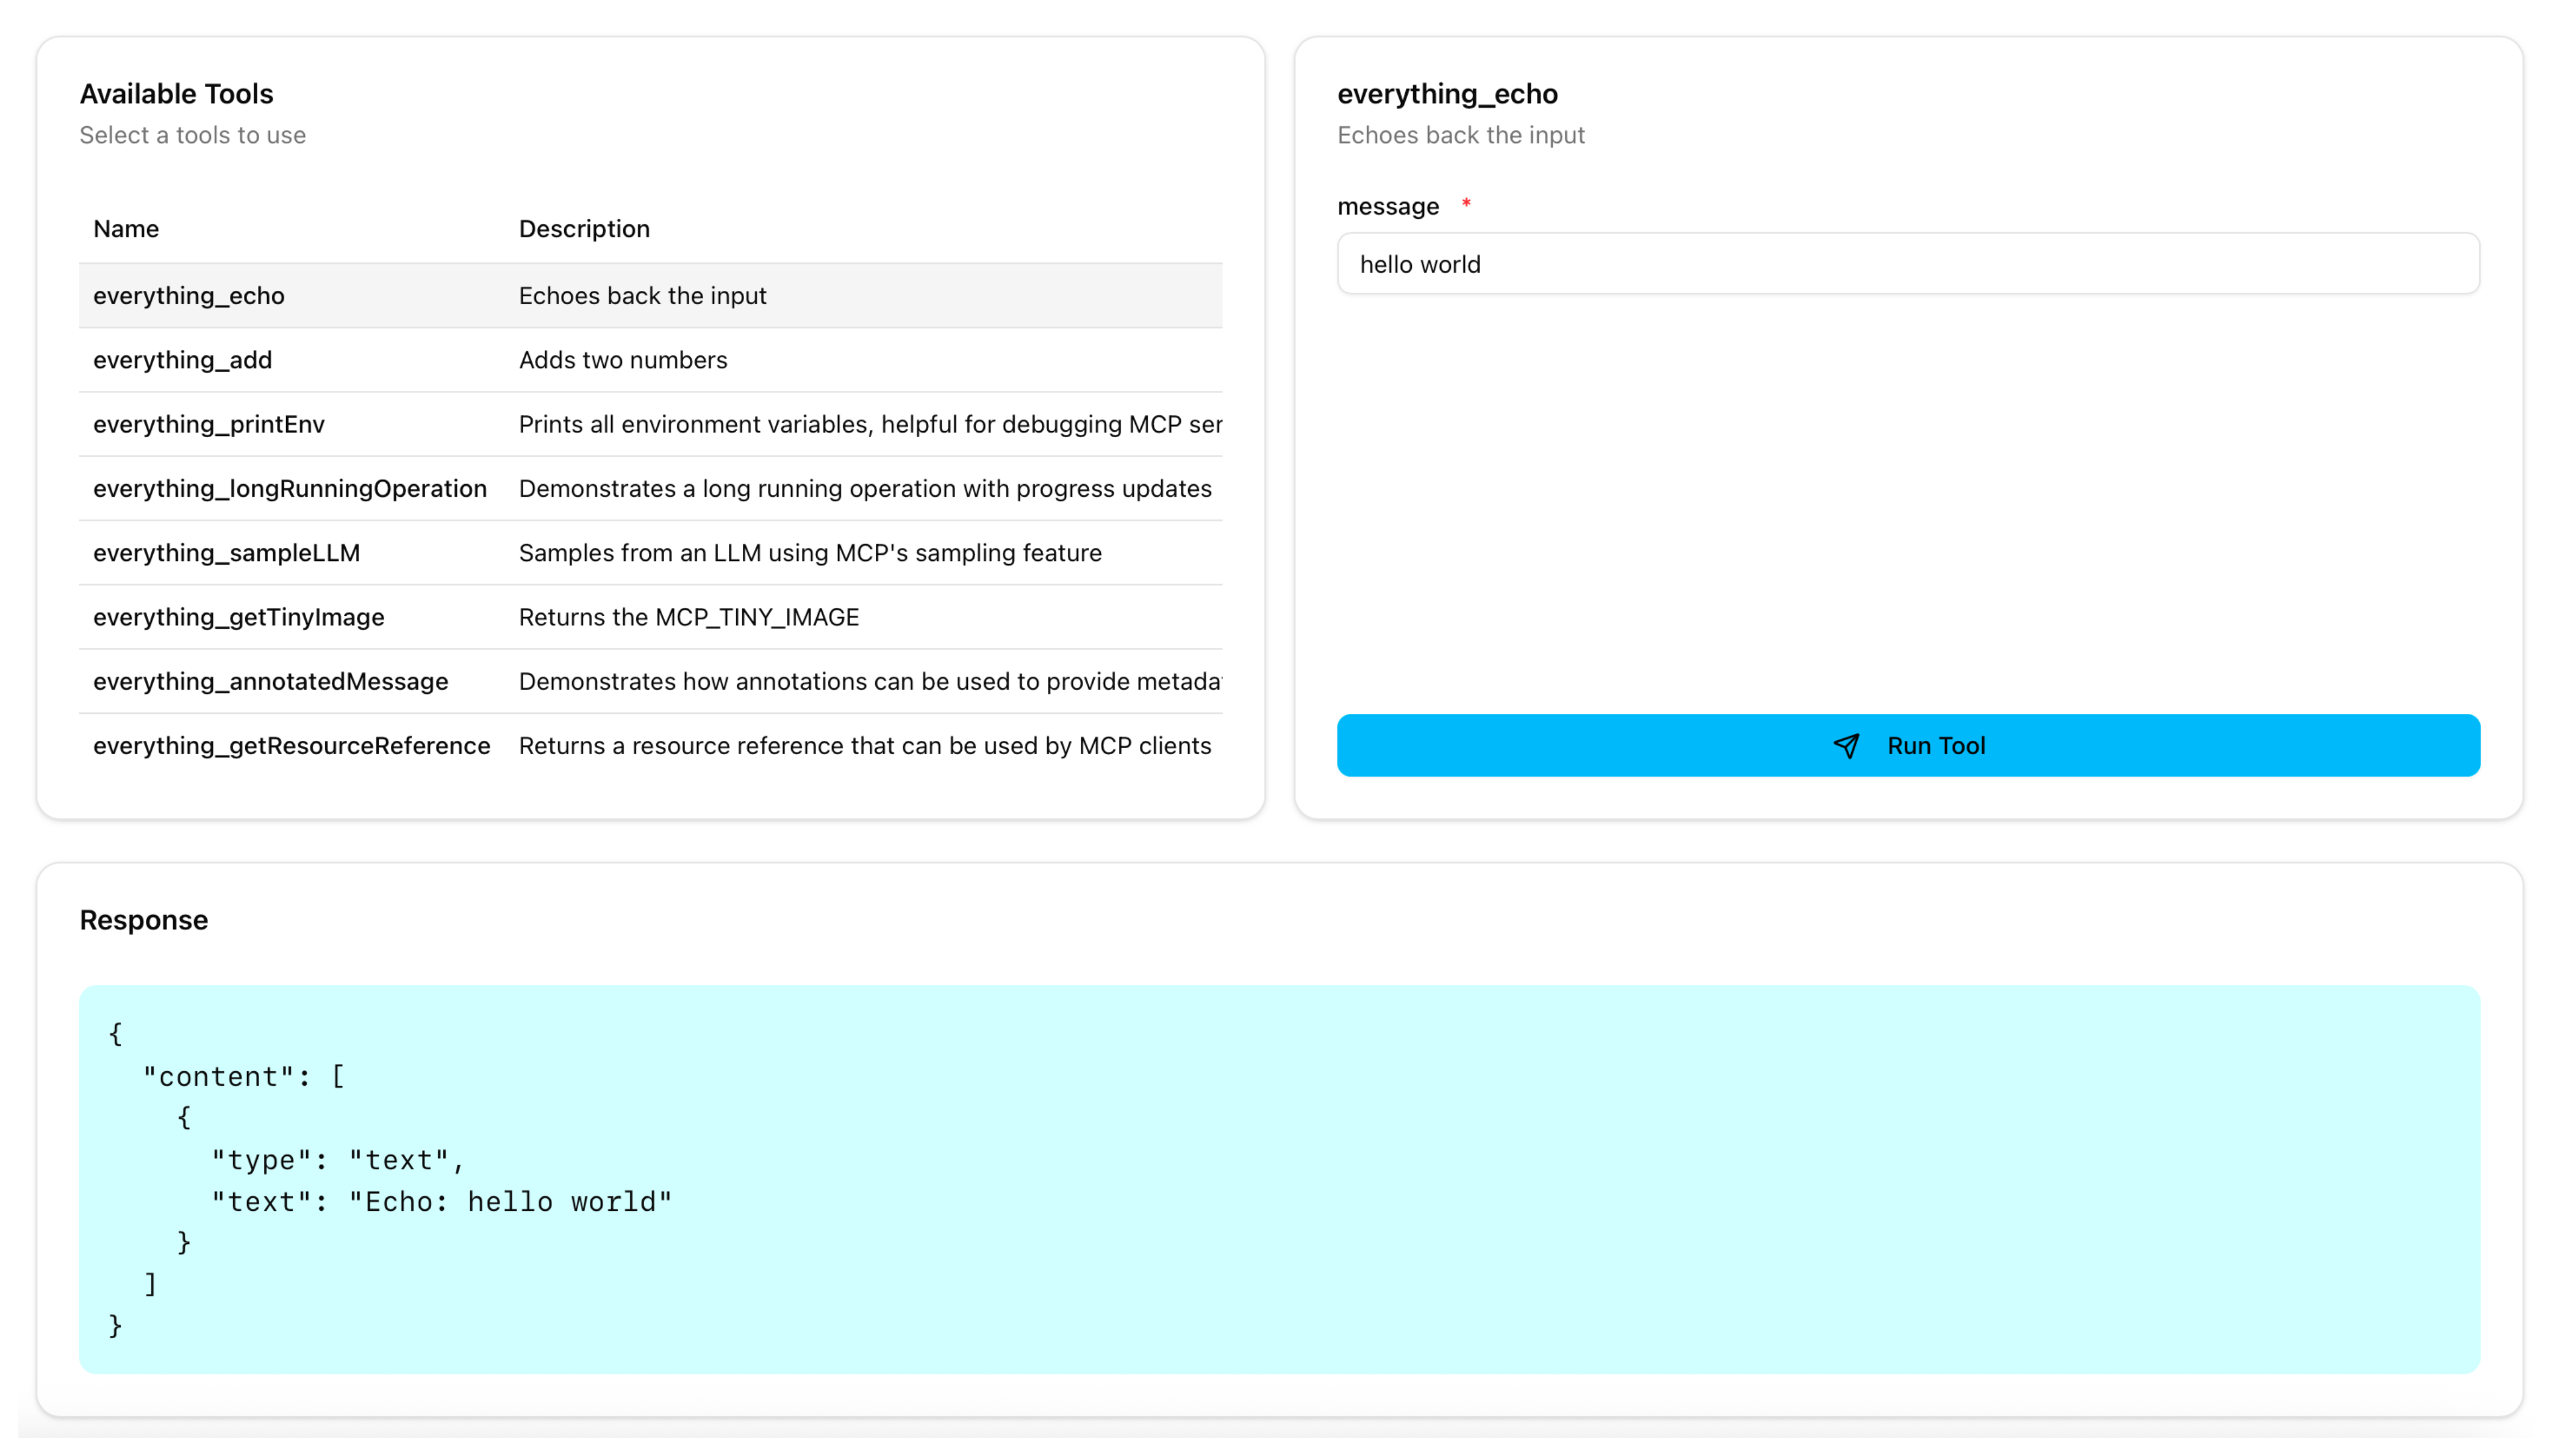
Verify access to a tool.
-
From the Available Tools list, select the
everything_echo
tool. -
In the message field, enter any string, such as
hello world
, and click Run Tool. -
Verify that you see your message echoed in the Response card.
-
-
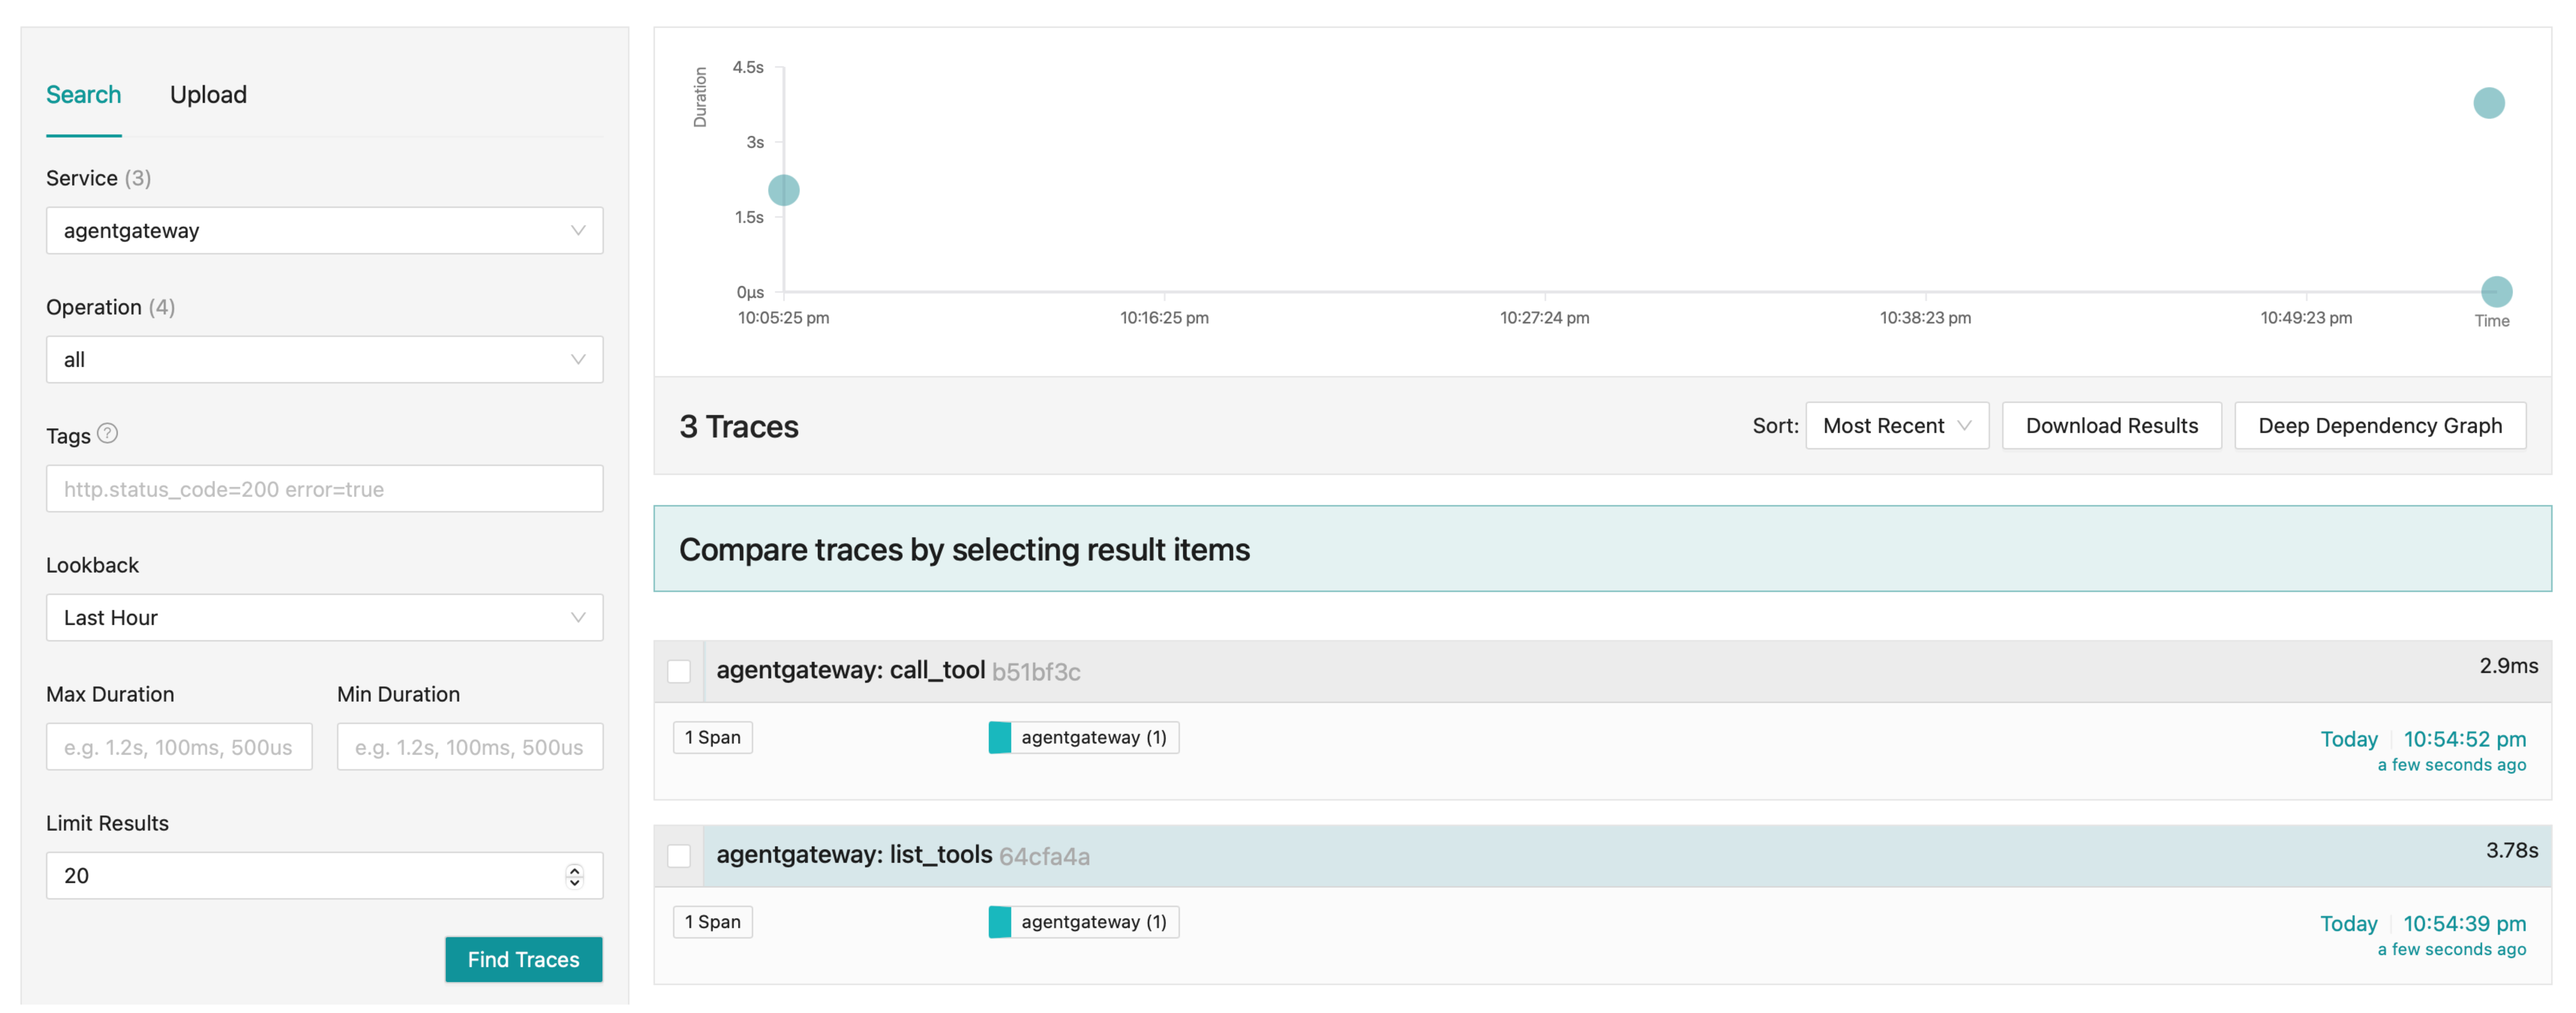
Open the Jaeger UI.
-
View traces.
- From the Service drop down, select
agentgateway
. - Click Find Traces.
- Verify that you can see trace spans for listing the MCP tools (
list_tools
) and calling a tool (call_tool
).
- From the Service drop down, select
Add tags to traces
You can optionally enrich the traces that are captured by the Agent Gateway with tags. Tags are key-value pairs that can have the following format:
- Static key-value pair, where the key and value do not change. For example, use
"custom-tag": "test"
to add this tag to all traces that are captured by the Agent Gateway. - Claim-based key-value pair, where you map the value of a specific JWT claim to a key. For example, if the username is captured in a
sub
claim in your JWT, you can map that username to auser
tag by using the following syntax"user": "@sub"
.
-
Download a sample, local JWT public key file. You use this file to validate JWTs later.
https://raw.githubusercontent.com/agentgateway/agentgateway/refs/heads/main/manifests/jwt/pub-key
-
Create a configuration file for your Agent Gateway. In this example, you configure the following elements:
- Listener: An SSE listener that listens for incoming traffic on port 3000. The listener requires a JWT to be present in an
Authorization
header. You use the local JWT public key file to validate the JWT. Only JWTs that include thesub: me
claim can authenticate with the Agent Gateway successfully. If the request has a JWT that does not include this claim, the request is denied. - Traces: The Agent Gateway is configured to send traces to the OpenTelemetry collector that you exposed on
http://localhost:4317
. In addition, the Agent Gateway is configured to inject thecustom-tag: test
tag and to extract thesub
claim from the JWT token and map it to theuser
tag. - Target: The Agent Gateway targets a sample, open source MCP test server,
server-everything
.
cat <<EOF > ./config.json { "type": "static", "listeners": [ { "name": "sse", "protocol": "MCP", "sse": { "address": "[::]", "port": 3000, "authn": { "jwt": { "issuer": [ "me" ], "audience": [ "me.com" ], "local_jwks": { "file_path": "./pub-key" } } } } } ], "tracing": { "tracer": { "otlp": { "endpoint": "http://localhost:4317" } }, "tags": { "user": "@sub", "custom-tag": "test" } }, "targets": { "mcp": [ { "name": "everything", "stdio": { "cmd": "npx", "args": [ "@modelcontextprotocol/server-everything" ] } } ] } } EOF
- Listener: An SSE listener that listens for incoming traffic on port 3000. The listener requires a JWT to be present in an
-
Run the Agent Gateway.
agentgateway -f config.json
-
Open the Agent Gateway UI to view your listener and target configuration.
-
Connect to the MCP server with the Agent Gateway UI playground.
-
Go to the Agent Gateway UI Playground.
-
In the Connection Settings card, select your Listener Endpoint.
-
In the Bearer Token field, enter the following JWT token. The JWT token includes the
sub: me
claim that is allowed access to theeverything_echo
tool.eyJhbGciOiJFUzI1NiIsImtpZCI6IlhoTzA2eDhKaldIMXd3a1dreWVFVXhzb29HRVdvRWRpZEVwd3lkX2htdUkiLCJ0eXAiOiJKV1QifQ.eyJhdWQiOiJtZS5jb20iLCJleHAiOjE5MDA2NTAyOTQsImlhdCI6MTc0Mjg2OTUxNywiaXNzIjoibWUiLCJqdGkiOiI3MDViYjM4MTNjN2Q3NDhlYjAyNzc5MjViZGExMjJhZmY5ZDBmYzE1MDNiOGY3YzFmY2I1NDc3MmRiZThkM2ZhIiwibmJmIjoxNzQyODY5NTE3LCJzdWIiOiJtZSJ9.cLeIaiWWMNuNlY92RiCV3k7mScNEvcVCY0WbfNWIvRFMOn_I3v-oqFhRDKapooJZLWeiNldOb8-PL4DIrBqmIQ
-
Click Connect. The Agent Gateway UI connects to the target that you configured and retrieves the tools that are exposed on the target.
-
Verify that you see a list of Available Tools.
-
-
Select the
everything_echo
tool, enter any string in the message field, such ashello world
, and click Run Tool. Verify that access to the tool is granted and that you see your message echoed. -
Open the Jaeger UI.
-
View traces.
- From the Service drop down, select
agentgateway
. - Click Find Traces.
- Verify that you can see trace spans for listing the MCP tools (
list_tools
) and calling a tool (call_tool
). - Expand a trace and verify that you see the
custom-tag=test
anduser=me
tags for each trace span.
- From the Service drop down, select