For the complete documentation index, see llms.txt. Markdown versions of all docs pages are available by appending .md to any docs URL.
Prometheus
Scrape agentgateway metrics with Prometheus.
Prometheus is an open-source monitoring system that scrapes and stores time-series metrics. It is the standard way to collect and query agentgateway metrics, and is the data source behind the Grafana dashboard. Prometheus is well-suited for agentgateway because it efficiently handles high-cardinality label sets, such as per-route, per-model, and per-provider breakdowns. Its query language (PromQL) makes it easy to build alerts and dashboards from those labels.
Agentgateway is built to work with Prometheus out of the box:
- It exposes a
/metricsendpoint on port15020in the OpenMetrics format, which Prometheus can scrape directly. - All metrics use the
agentgateway_prefix and carry consistent route identifier labels so you can filter and aggregate by gateway, listener, and route without additional configuration. - On Kubernetes, the agentgateway chart annotates proxy pods with
prometheus.io/scrape: "true"andprometheus.io/port: "15020"for Prometheus installs that use annotation-based discovery, and ships an optionalPodMonitorfor installs that run the Prometheus Operator.
Set up Prometheus
Set up a Prometheus instance and use PromQL queries to query them. The steps to set up Prometheus vary depending on the way you installed agentgateway.
Create a Prometheus configuration file that scrapes agentgateway.
cat > prometheus.yml <<EOF
scrape_configs:
  - job_name: agentgateway
    static_configs:
      - targets:
          - host.docker.internal:15020
    scrape_interval: 15s
EOF
Run Prometheus with Docker.
docker run -d --name prometheus \
  -p 9090:9090 \
  -v $(pwd)/prometheus.yml:/etc/prometheus/prometheus.yml \
  prom/prometheus:latest
Open the Prometheus UI at http://localhost:9090.
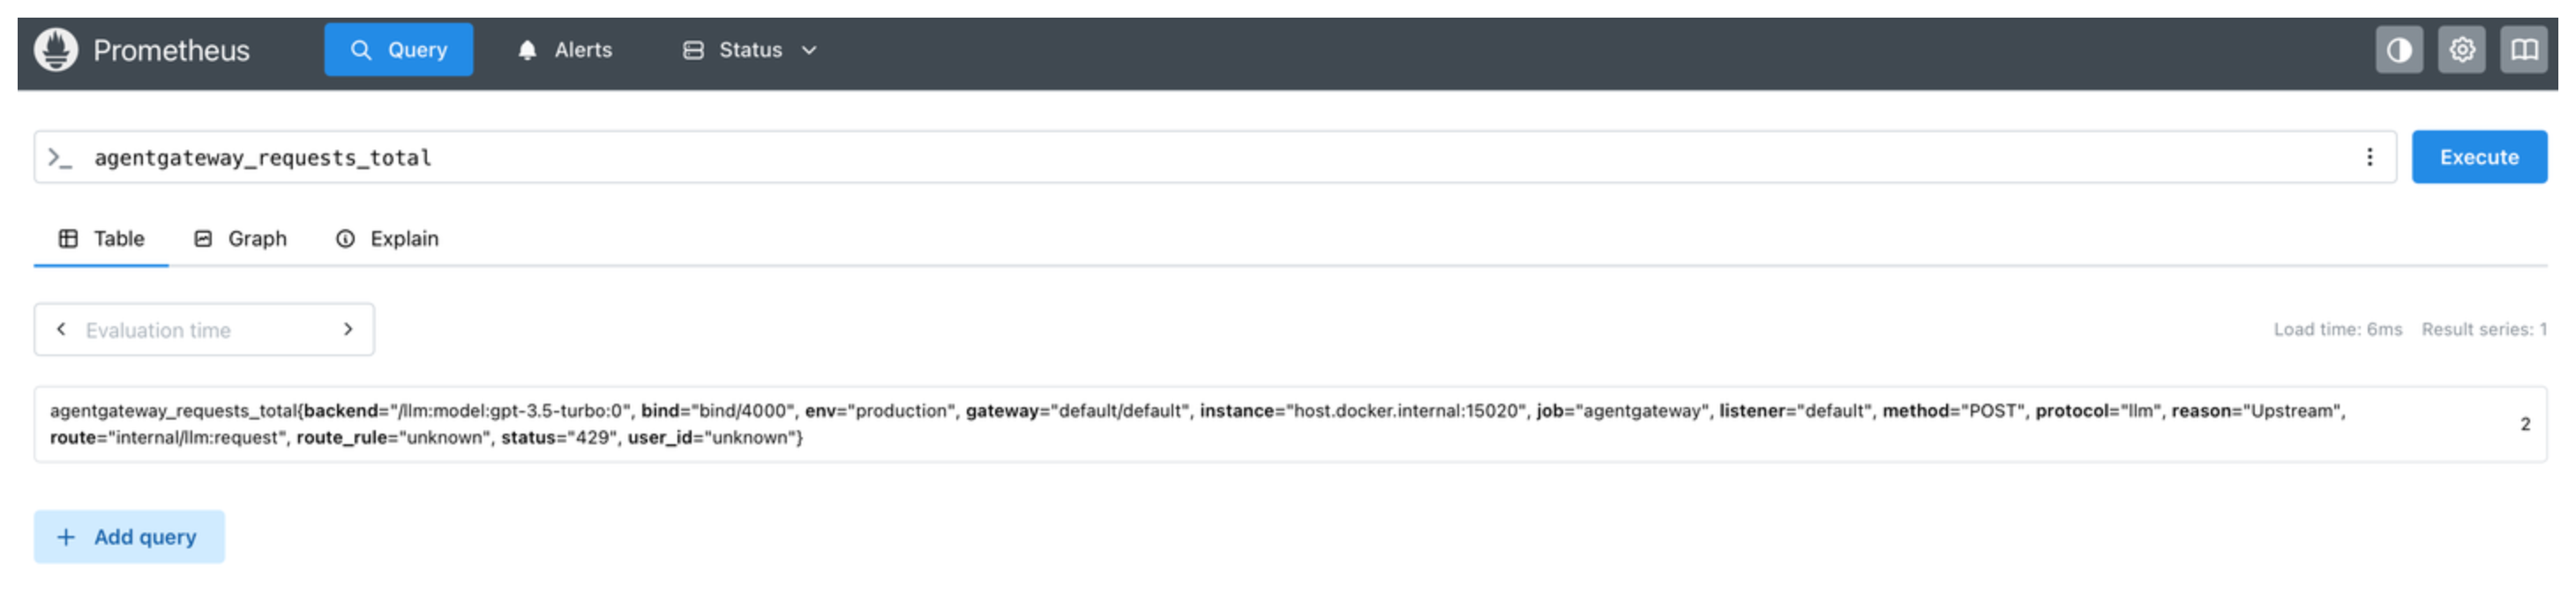
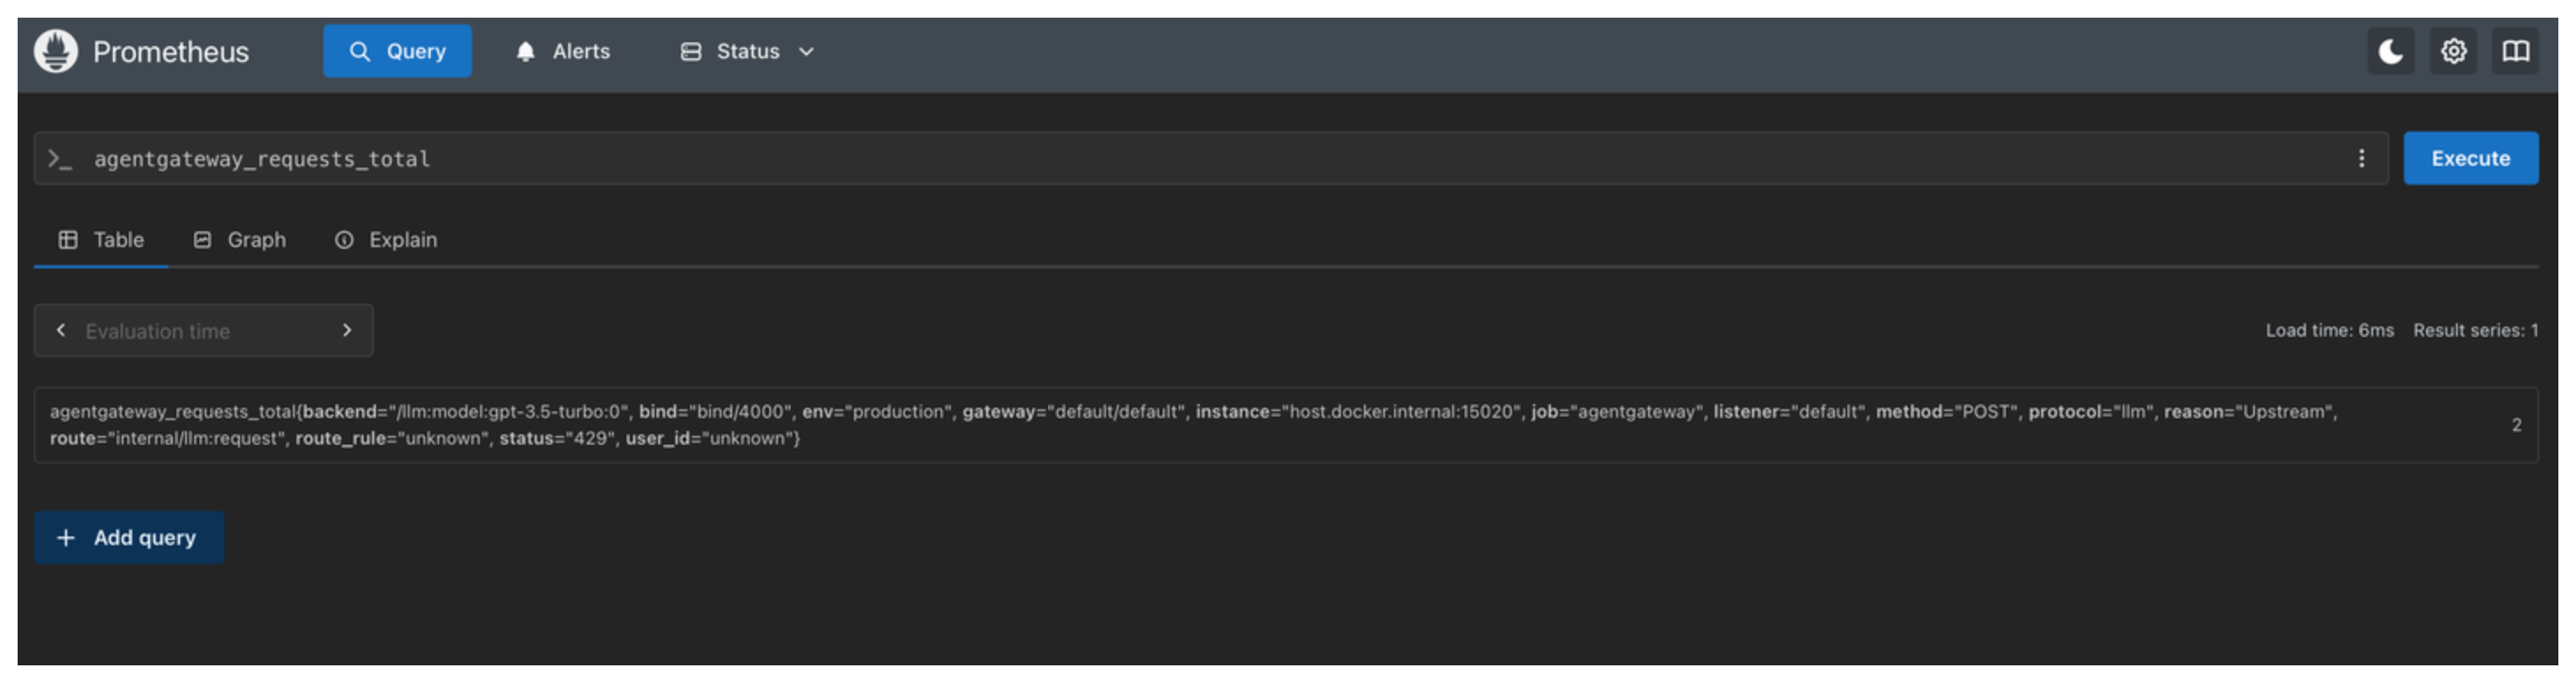
Run a PromQL query to verify that agentgateway metrics are being scraped. In the Prometheus UI, enter the following query and click Execute.
agentgateway_requests_totalThe result shows the total number of requests that are handled by agentgateway, broken down by gateway, listener, route, and status.
When you are done, remove the Prometheus container.
docker rm -f prometheus
Other configurations
Review other common Prometheus configurations.
Docker Compose
To run agentgateway, Prometheus, and Grafana together as a single stack, use Docker Compose instead of individual containers.
services:
  agentgateway:
    image: cr.agentgateway.dev/agentgateway:latest
    ports:
      - "3000:3000"
      - "15020:15020"
    volumes:
      - ./config.yaml:/config.yaml:ro
    command: ["-f", "/config.yaml"]

  prometheus:
    image: prom/prometheus:latest
    ports:
      - "9090:9090"
    volumes:
      - ./prometheus.yml:/etc/prometheus/prometheus.yml

  grafana:
    image: grafana/grafana:latest
    ports:
      - "3001:3000"
    environment:
      - GF_SECURITY_ADMIN_PASSWORD=admin
    volumes:
      - grafana-data:/var/lib/grafana

volumes:
  grafana-data: