For the complete documentation index, see llms.txt. Markdown versions of all docs pages are available by appending .md to any docs URL.
View and customize logs
Configure per-request structured access logs with CEL-based filtering, field enrichment, and OTLP export.
Agentgateway writes a structured access log line to stdout for every request it processes. Access logs are separate from debug/system logs, which control agentgateway’s own operational output.
Access log format
By default, access logs are written in a structured key=value format as shown in the following example.
2025-12-12T21:56:02.809082Z	info	request gateway=agentgateway listener=http route=openai endpoint=api.openai.com:443
src.addr=127.0.0.1:60862 http.method=POST http.host=localhost http.path=/openai http.version=HTTP/1.1
http.status=200 protocol=llm gen_ai.operation.name=chat gen_ai.provider.name=openai
gen_ai.request.model=gpt-4o gen_ai.response.model=gpt-4o-2024-08-06
gen_ai.usage.input_tokens=68 gen_ai.usage.output_tokens=298 duration=2488ms
For LLM traffic, the log line automatically includes gen_ai.* fields. For MCP traffic, it includes mcp.* fields.
You can change the default log format to JSON by setting the config.logging.format field.
# yaml-language-server: $schema=https://agentgateway.dev/schema/config
config:
  logging:
    format: json
View access logs in the UI
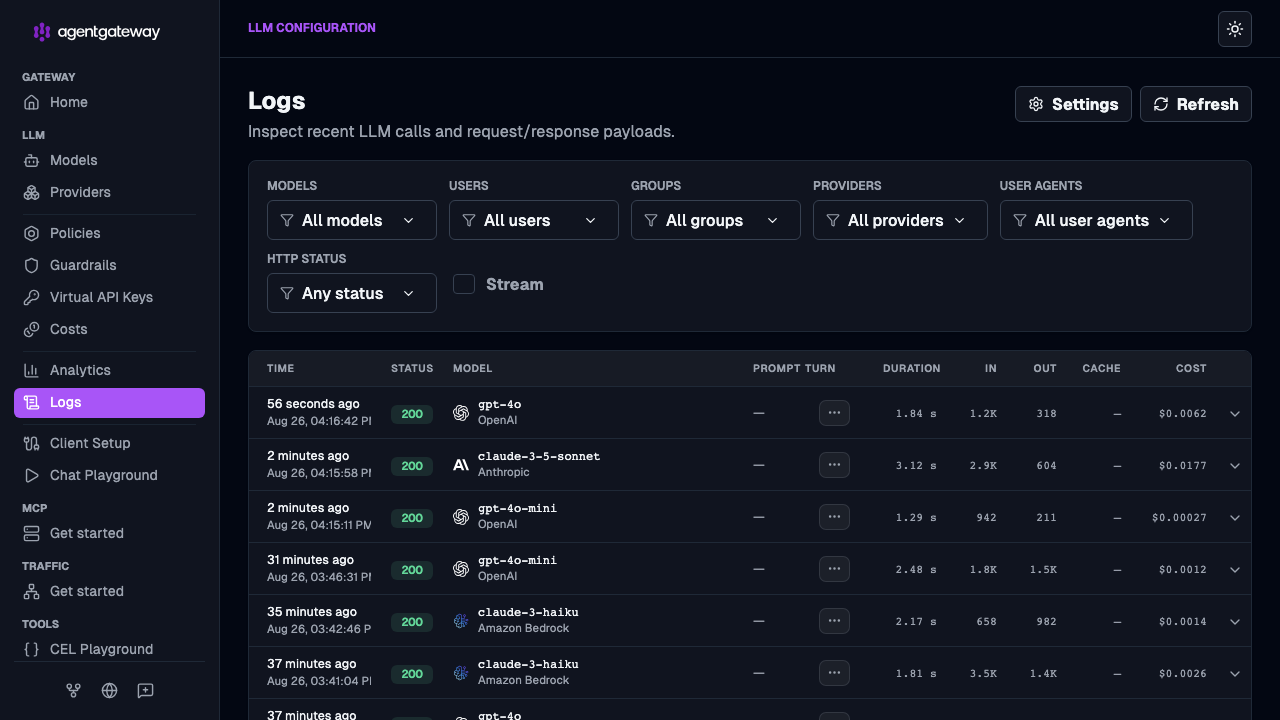
The agentgateway UI includes a Logs page that you can use to review the access logs that were captured by your proxy.
To view access logs in the UI:
Open the agentgateway UI. This address is the copy of the UI on the admin interface, which works from the host that runs the proxy. If you serve the UI on a gateway, use that gateway’s port instead.
Go to Logs and review the access logs that agentgateway captured for your previous requests. Use the filter options to limit the number of access logs that are shown to you. For example, you can filter logs by model, providers, or users. Note that in order to filter logs by user, you must configure authentication in agentgateway.
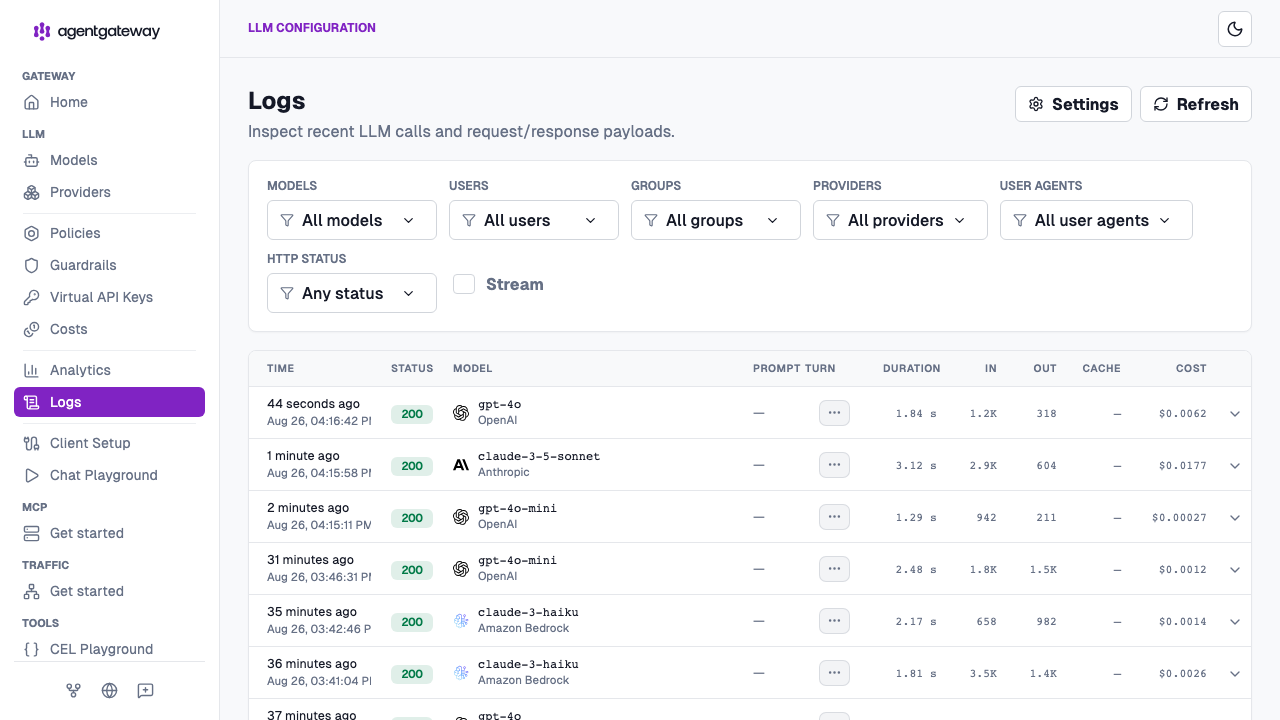
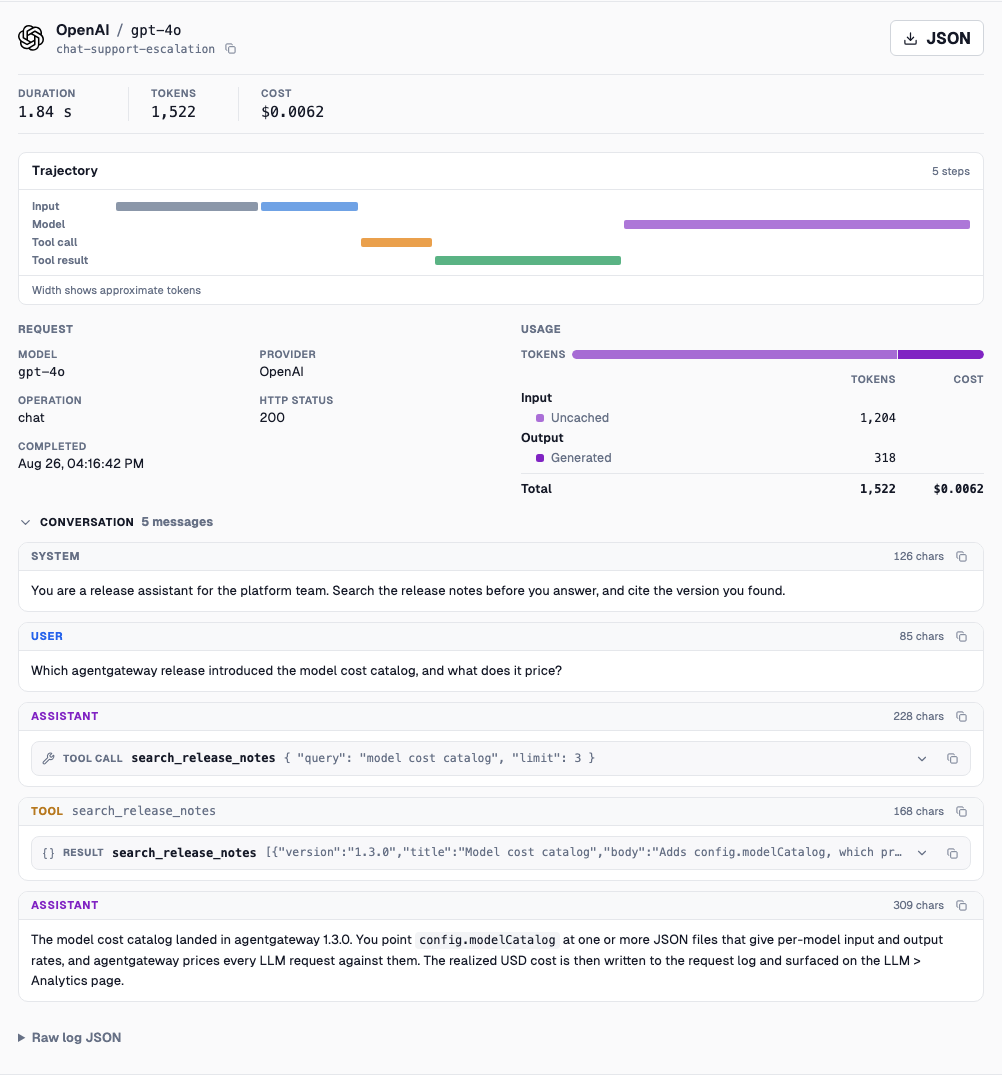
Optional: Enable richer access logging for LLM and MCP-specific requests by going to the log Settings and toggling Include prompts and completions in logs. For every request that you sent through agentgateway, the following additional information is captured:
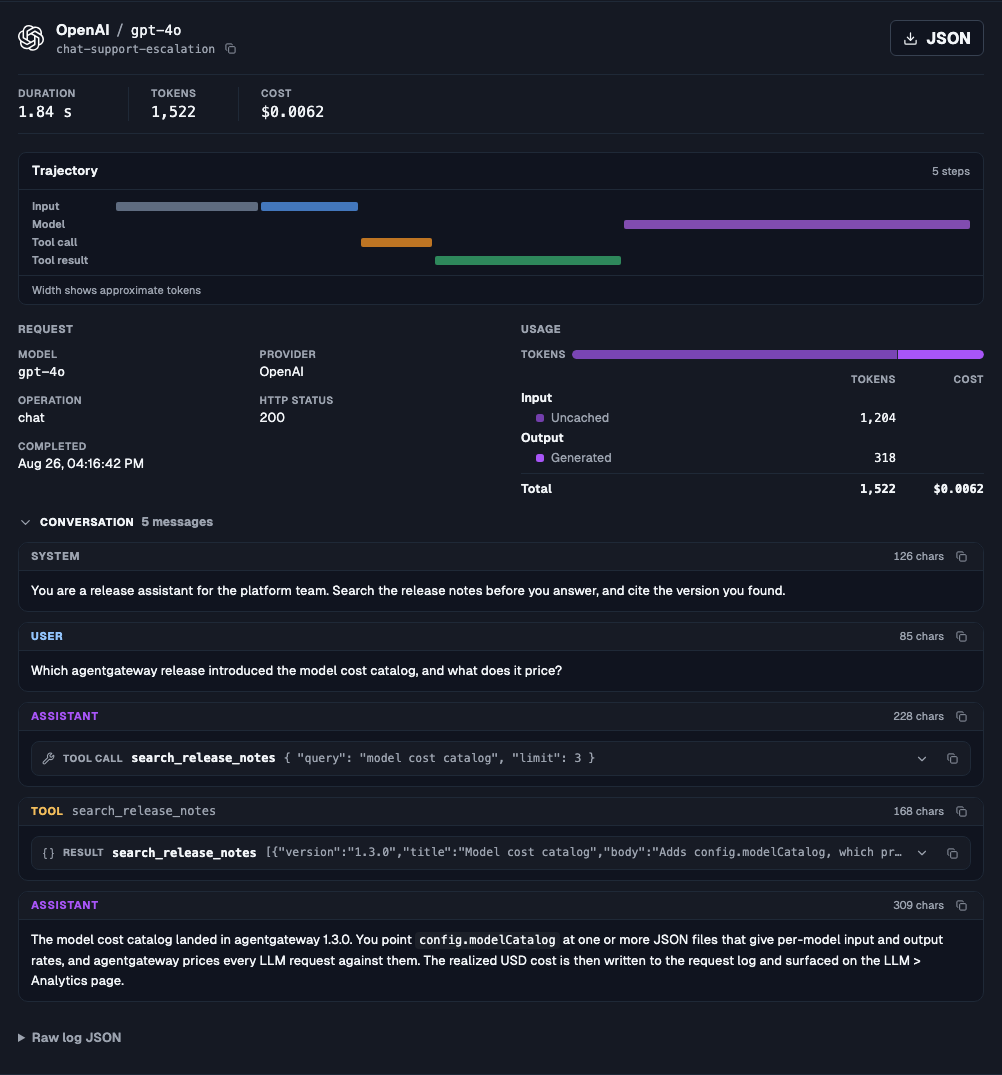
- Trajectory: Review the steps that your request took, including tool calls, and how many tokens were spent in each step. Each step is represented as a line. The longer the line is, the more tokens were used in that step.
- Conversation view: See the details of your conversation with the LLM provider, such as the prompt that you sent and the reply that you got from the LLM.
Select a log entry to open it and review its trajectory and conversation.
Filter requests
Use a CEL expression to log only a subset of requests. Requests that do not match the expression are not logged. The following example produces access logs only for requests with a response code of 400 or greater.
# yaml-language-server: $schema=https://agentgateway.dev/schema/config
frontendPolicies:
  accessLog:
    filter: 'response.code >= 400'
Add custom fields to logs
You can add custom fields to every access log line by using CEL expressions that are evaluated against the request and response context.
The following example adds 3 fields to every access log entry:
user_id: Extracts the value of thex-user-idrequest header.env: Adds a static string ofproduction.cost: Converts the LLM request cost to a string and logs it.
# yaml-language-server: $schema=https://agentgateway.dev/schema/config
frontendPolicies:
  accessLog:
    add:
      user_id: 'request.headers["x-user-id"]'
      env: '"production"'
      cost: 'string(llm.cost)'
For the full list of available fields, see the CEL variables reference.
Remove fields from logs
Remove fields from access log lines. The following example removes the source address and HTTP path that are included by default.
# yaml-language-server: $schema=https://agentgateway.dev/schema/config
frontendPolicies:
  accessLog:
    remove:
      - src.addr
      - http.path