For the complete documentation index, see llms.txt. Markdown versions of all docs pages are available by appending .md to any docs URL.
Datadog
Export agentgateway metrics and LLM traces to Datadog.
Datadog collects metrics and OpenTelemetry traces from agentgateway. Choose the setup that matches what you want to observe.
| Setup | Telemetry | When to use it |
|---|---|---|
| Complete example | Proxy metrics, LLM traces, and a dashboard | Evaluate the integration end to end or use it as a production reference |
| Direct trace export | LLM traces | Add tracing to an existing deployment with the fewest components |
The complete example is the recommended starting point. It runs the Datadog Agent and OpenTelemetry Collector locally with Docker Compose. The direct setup sends traces from agentgateway to Datadog’s hosted OTLP endpoint.
Before you begin
For the complete example, you need:
- Docker with Docker Compose.
- uv and
curl. - Free loopback ports
13000,18080, and18520. - A Datadog organization, API key, and the correct Datadog site to export telemetry.
- Agent Observability enabled in your Datadog organization to view LLM traces.
The first three steps of the example validate the gateway locally and need no Datadog account. The remaining steps export telemetry, so they do.
The direct setup requires a running agentgateway installation and a Datadog API key. If you have not installed agentgateway or configured an LLM provider, complete the LLM quickstart first.
Run the complete example
The Datadog standalone example
supports two modes. The base compose.yaml file runs agentgateway,
a synthetic OpenAI-compatible provider, and an OpenTelemetry Collector for
local validation.
It does not send telemetry to Datadog. Adding compose.datadog.yaml starts the
Datadog Agent and exports the synthetic metrics and traces to your Datadog
organization. Both modes use the synthetic provider and do not call a paid
model.
Note
The example pins the agentgateway and Datadog Agent versions it was tested against, and its OpenTelemetry Collector configuration includes workarounds for that release. Check the example README for the pinned versions before you run it against a newer release.
Clone the agentgateway repository and change to the example directory.
git clone https://github.com/agentgateway/agentgateway.git
cd agentgateway/examples/datadog/standalone
Validate the gateway, synthetic provider, metrics, and trace export locally.
docker compose up -d
uv run ../smoke.py
Inspect the raw Prometheus metrics exposed by the proxy.
curl http://127.0.0.1:18520/metricsCreate an ignored
.envfile for your Datadog credentials.DD_API_KEY=replace-with-your-datadog-api-key DD_SITE=us3.datadoghq.comProtect the file with
chmod 600 .env.Note
Datadog API keys and application keys are different. This example requires an API key to ingest telemetry.
Start the same services with the Datadog export override, generate traffic, and perform successive OpenMetrics checks.
docker compose -f compose.yaml -f compose.datadog.yaml up -d
uv run ../smoke.py --datadog
docker compose -f compose.yaml -f compose.datadog.yaml \
  exec datadog agent check openmetrics --check-rate
The first counter scrape establishes a baseline. Repeat the smoke test across scrape intervals when populating rate charts.
In Datadog, open Metrics > Explorer, filter by
env:datadog-dev, and search for an exact metric name.agentgateway.requests.countagentgateway.gen_ai.token.usage.sumagentgateway.gen_ai.cost.usd.count
In Dashboards, import the example’s
dashboard.jsonand set theenvtemplate variable todatadog-dev. Enable percentile aggregations in Metrics Summary for the latency distributions before you use the p95 widgets. Controller, MCP, and guardrail widgets remain empty until their corresponding components or traffic are present.
The example uses the synthetic datadog-test model, which is not in Datadog’s
pricing catalog, so Datadog displays Cost unavailable. The cost calculated
from the synthetic provider’s rates is still in the span’s agw.ai.usage.cost.* attributes and the agentgateway.gen_ai.cost.usd.count metric. The README
explains how to send a request to a real OpenAI model and compare the two
estimates, and how to capture synthetic prompts and completions.
By default, the example exports metadata-only traces. Review redaction, sampling, access controls, and custom-metric cardinality before adapting the example for production.
Configure direct trace export
Use this smaller setup when you only need traces and do not want to run the Datadog Agent locally. Replace the API key and change the host for your Datadog site if needed.
Add this tracing policy to your config.yaml.
# yaml-language-server: $schema=https://agentgateway.dev/schema/config
frontendPolicies:
  tracing:
    host: otlp.datadoghq.com:443
    protocol: grpc
    randomSampling: true
    policies:
      backendTLS: {}
      requestHeaderModifier:
        set:
DD-API-KEY: "<your-datadog-api-key>"For the EU region, use otlp.datadoghq.eu:443. This direct path does not
configure OpenMetrics collection or a dashboard.
Note
Keep API keys out of source control.
Verify LLM traces in Datadog
Both setups export LLM traces, so verify them the same way.
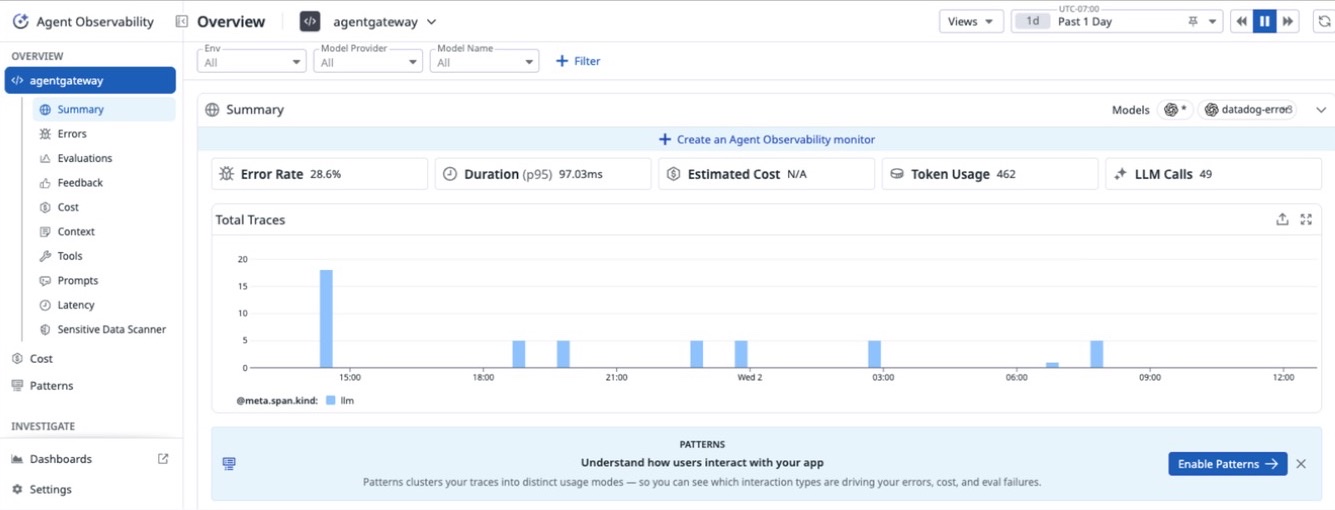
Open AI Observability > Applications and select agentgateway. The summary
shows LLM calls, token usage, duration, errors, and traces for the selected time
range.
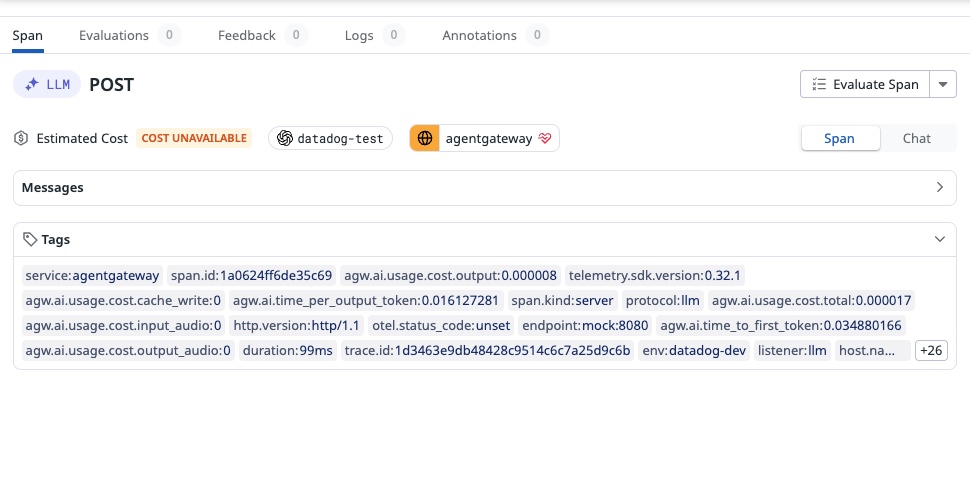
Open AI Observability > Traces and search for ml_app:agentgateway. Inspect
a span to verify its model, token counts, errors, timing, and parent-child trace
relationships. Allow several minutes for processing. A successful OTLP response
or a trace in APM alone does not prove ingestion into Agent Observability.
Troubleshooting
The Datadog Agent container is unhealthy
An invalid API key or incorrect DD_SITE can make the Agent unhealthy even
when its OpenMetrics check reaches agentgateway.
Verify the site and API key, then inspect the Agent.
docker compose -f compose.yaml -f compose.datadog.yaml ps
docker compose -f compose.yaml -f compose.datadog.yaml \
  exec datadog agent status
Do not share docker compose config, container inspection output, or the local .env file; those outputs can contain credentials.
Metrics are missing
A healthy agentgateway.openmetrics.health service check proves that the
endpoint responded; it does not prove that counter samples reached Datadog.
Run traffic between scrape intervals, repeat the check with --check-rate,
allow several minutes for indexing, and search by the exact metric name.
Traces are missing
Confirm that Agent Observability is enabled, the Agent is healthy, and DD_SITE selects the correct organization. Search for ml_app:agentgateway
and allow several minutes for processing. The default Docker Compose
configuration exports traces to the synthetic provider’s local trace-capture
endpoint; include compose.datadog.yaml to export them to Datadog.
Dashboard percentile widgets are empty
Enable percentile aggregations for the corresponding distribution metrics in Datadog Metrics Summary, allow time for processing, and confirm that more than one scrape occurred.
Cleanup
Stop the Datadog export configuration when you finish.
docker compose -f compose.yaml -f compose.datadog.yaml downTo return to local trace capture, start the default Docker Compose configuration without the Datadog override.