For the complete documentation index, see llms.txt. Markdown versions of all docs pages are available by appending .md to any docs URL.
Cost dashboard
Verified Code examples on this page have been automatically tested and verified.View LLM spend, tokens, and traffic in the built-in UI, grouped by model, provider, and user.
The Model costs guide prices every request and exposes the result to logs, metrics, and CEL. The built-in UI turns that data into a visual dashboard: spend, tokens, and calls over time, broken down by model, provider, user, group, or user agent. No external Prometheus or Grafana is required.
The dashboard is populated from a local database that agentgateway writes for every request that flows through the proxy. Because the accounting happens in the gateway, your applications need no changes. They point at the proxy, and spend shows up next to tokens automatically.
Requirements
Two pieces of configuration power the dashboard:
config.database: the database where agentgateway records an entry for each request. It is the store behind the dashboard’s time series and breakdowns.config.modelCatalog: the model cost catalog that turns token counts into dollars. The built-in catalog prices common public models without any configuration, so set this field to price other models or to override rates. Requests to models that no catalog prices still count toward token and call volume, but add no cost.
Enable the dashboard
Add
databaseandmodelCatalogto theconfigsection of your config file. TheadminAddrfield controls where the UI is served (defaultlocalhost:15000).# yaml-language-server: $schema=https://agentgateway.dev/schema/config config: adminAddr: localhost:15000 database: url: "sqlite://./data.db?mode=rwc" modelCatalog: - file: ./costs/catalog.json llm: port: 4000 models: - name: "*" provider: openAI params: apiKey: "$OPENAI_API_KEY"Start agentgateway.
agentgateway -f config.yamlExample output:
INFO app serving UI at http://localhost:15000/ui
Open the dashboard
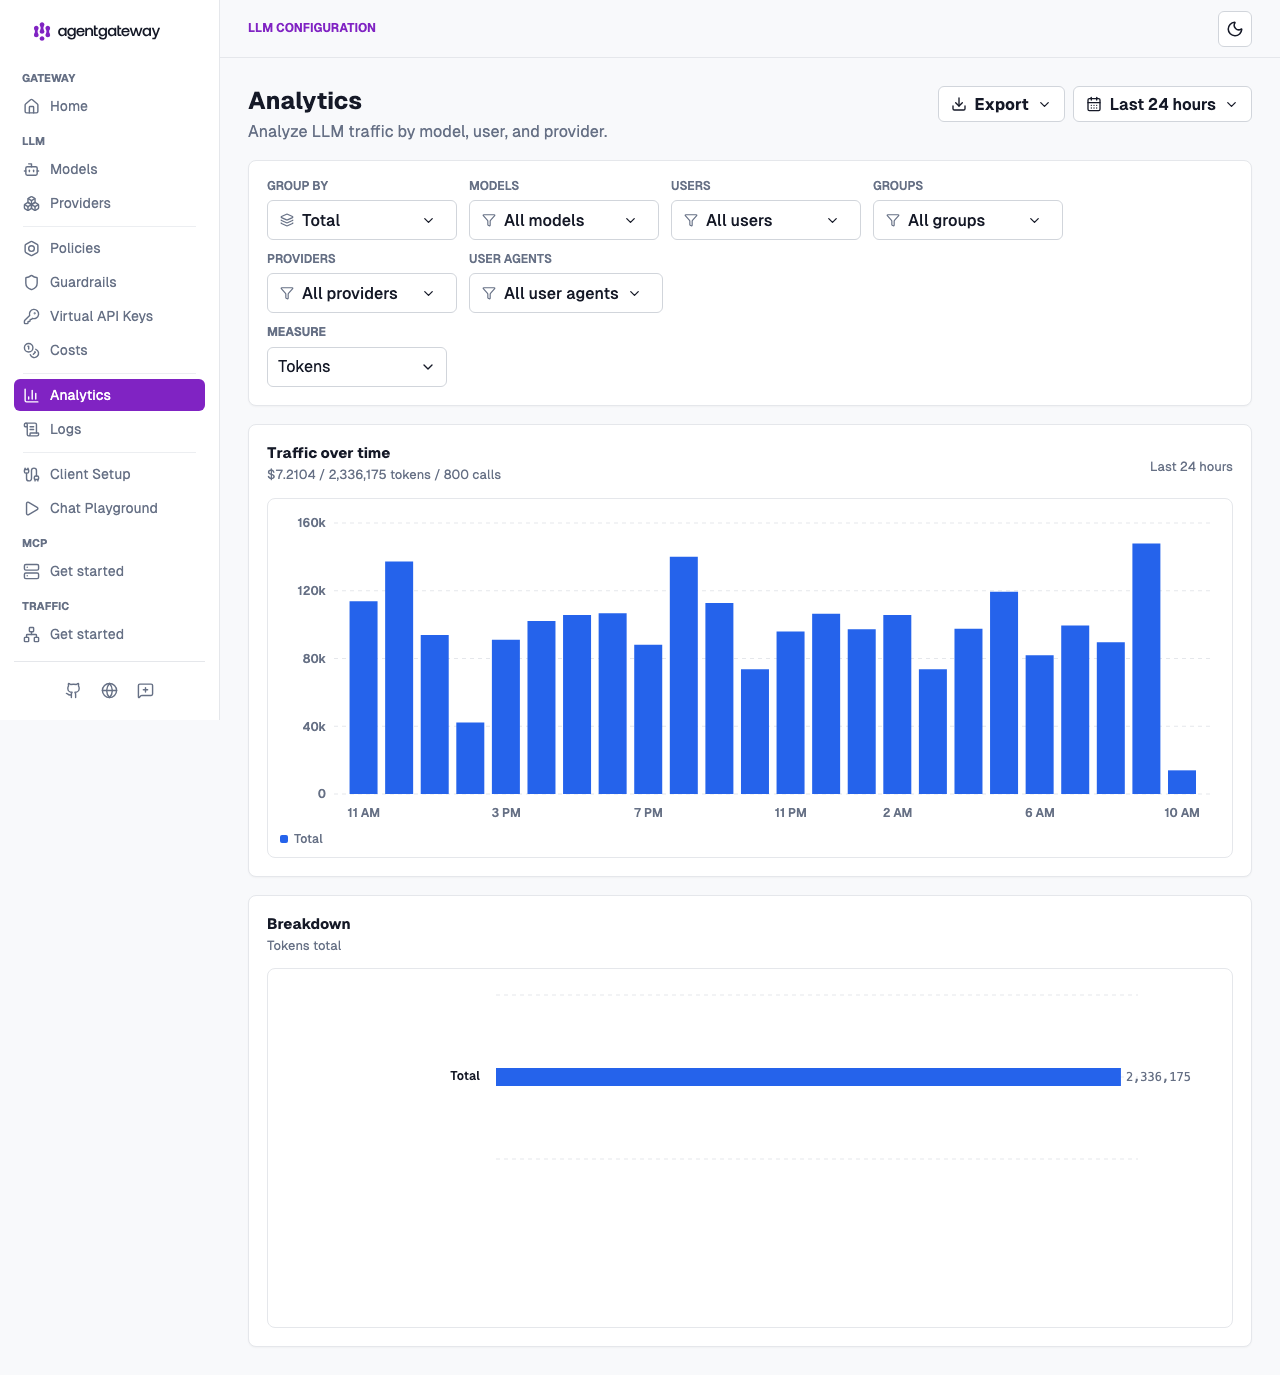
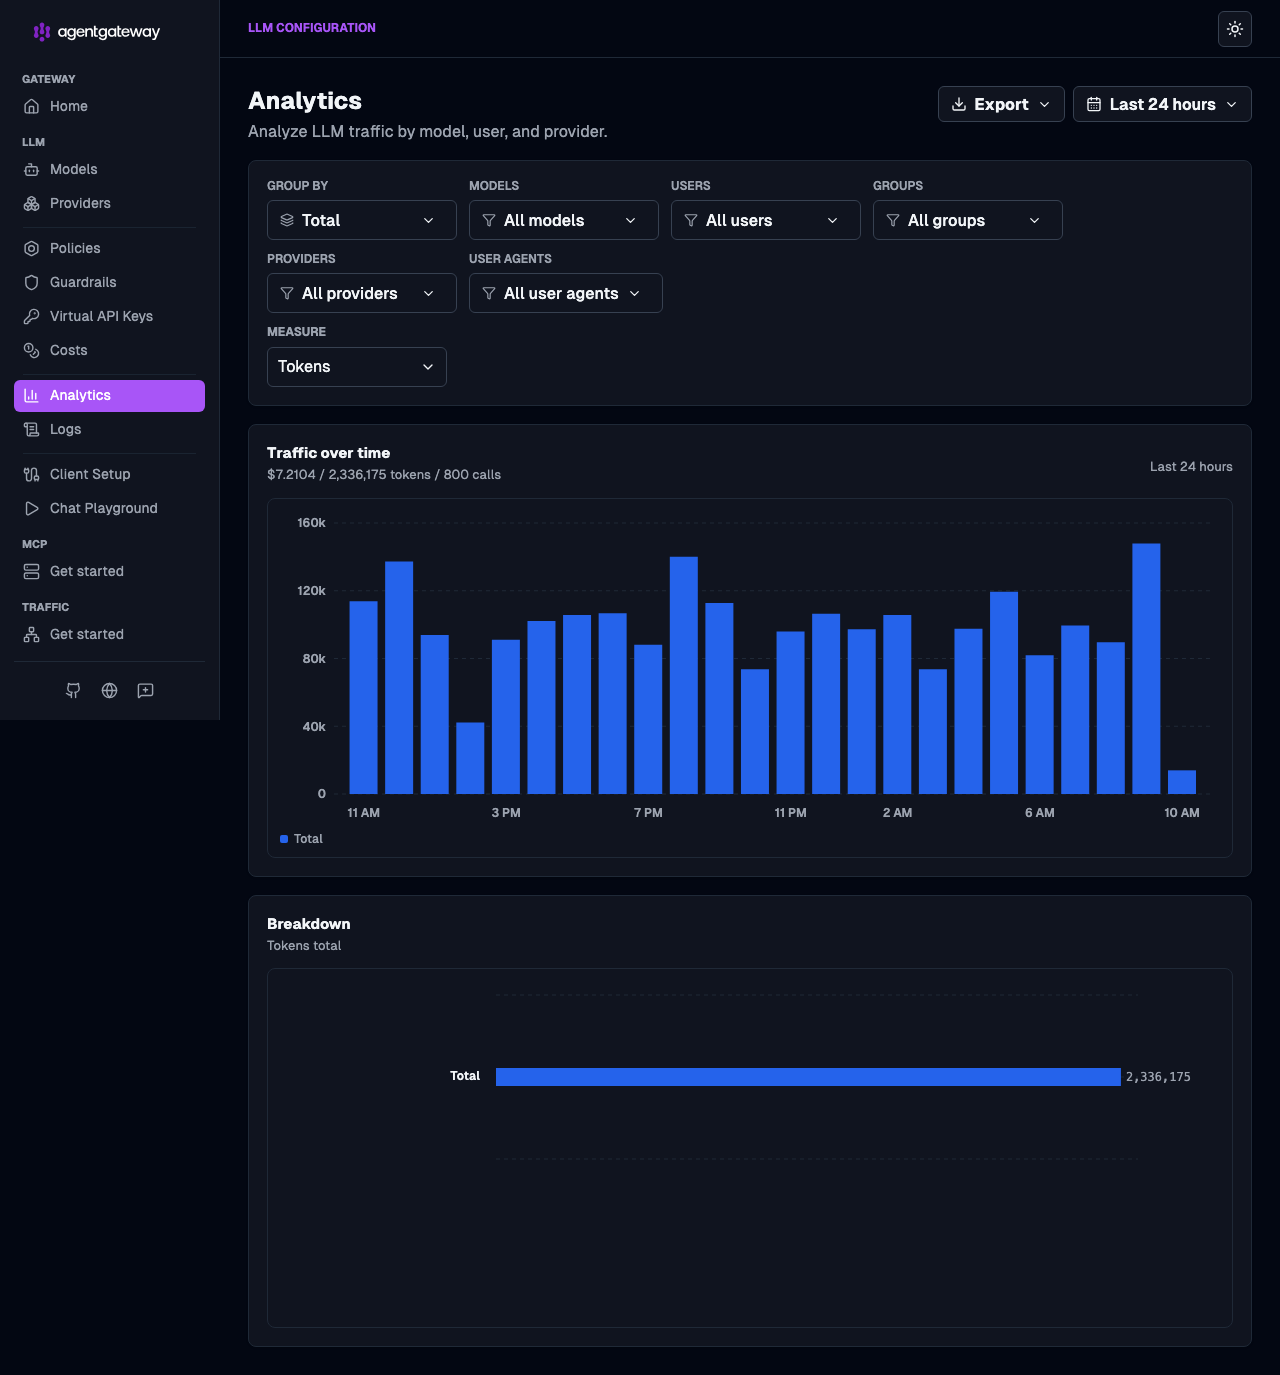
Review the dashboard in the LLM > Analytics page. Open http://localhost:15000/ui/llm/analytics. It shows traffic over time with a running tally of cost, tokens, and calls, plus a breakdown below the chart.
Note
The separate LLM > Costs page (http://localhost:15000/ui/llm/costs) is where you manage the cost catalog (import or override pricing), not where you view spend. See Model costs for catalog setup.
Group by and measure
Use the Group by control to break the same traffic down by:
- Model: which models drive spend (
gen_ai_request_model/gen_ai_response_model). - Provider: spend per backend, such as OpenAI, Anthropic, Google, or Bedrock (
gen_ai_provider_name). - User: per-person accounting, ideal for finding who drives spend (
agentgateway_user). - Group: spend per team or group (
agentgateway_group). - User agent: spend per client, such as Cursor, Claude Code, or
openai-python(user_agent_name).
Toggle Measure between tokens, cost, and requests to view the same breakdown either way. Set it to Cost to see realized spend in dollars.
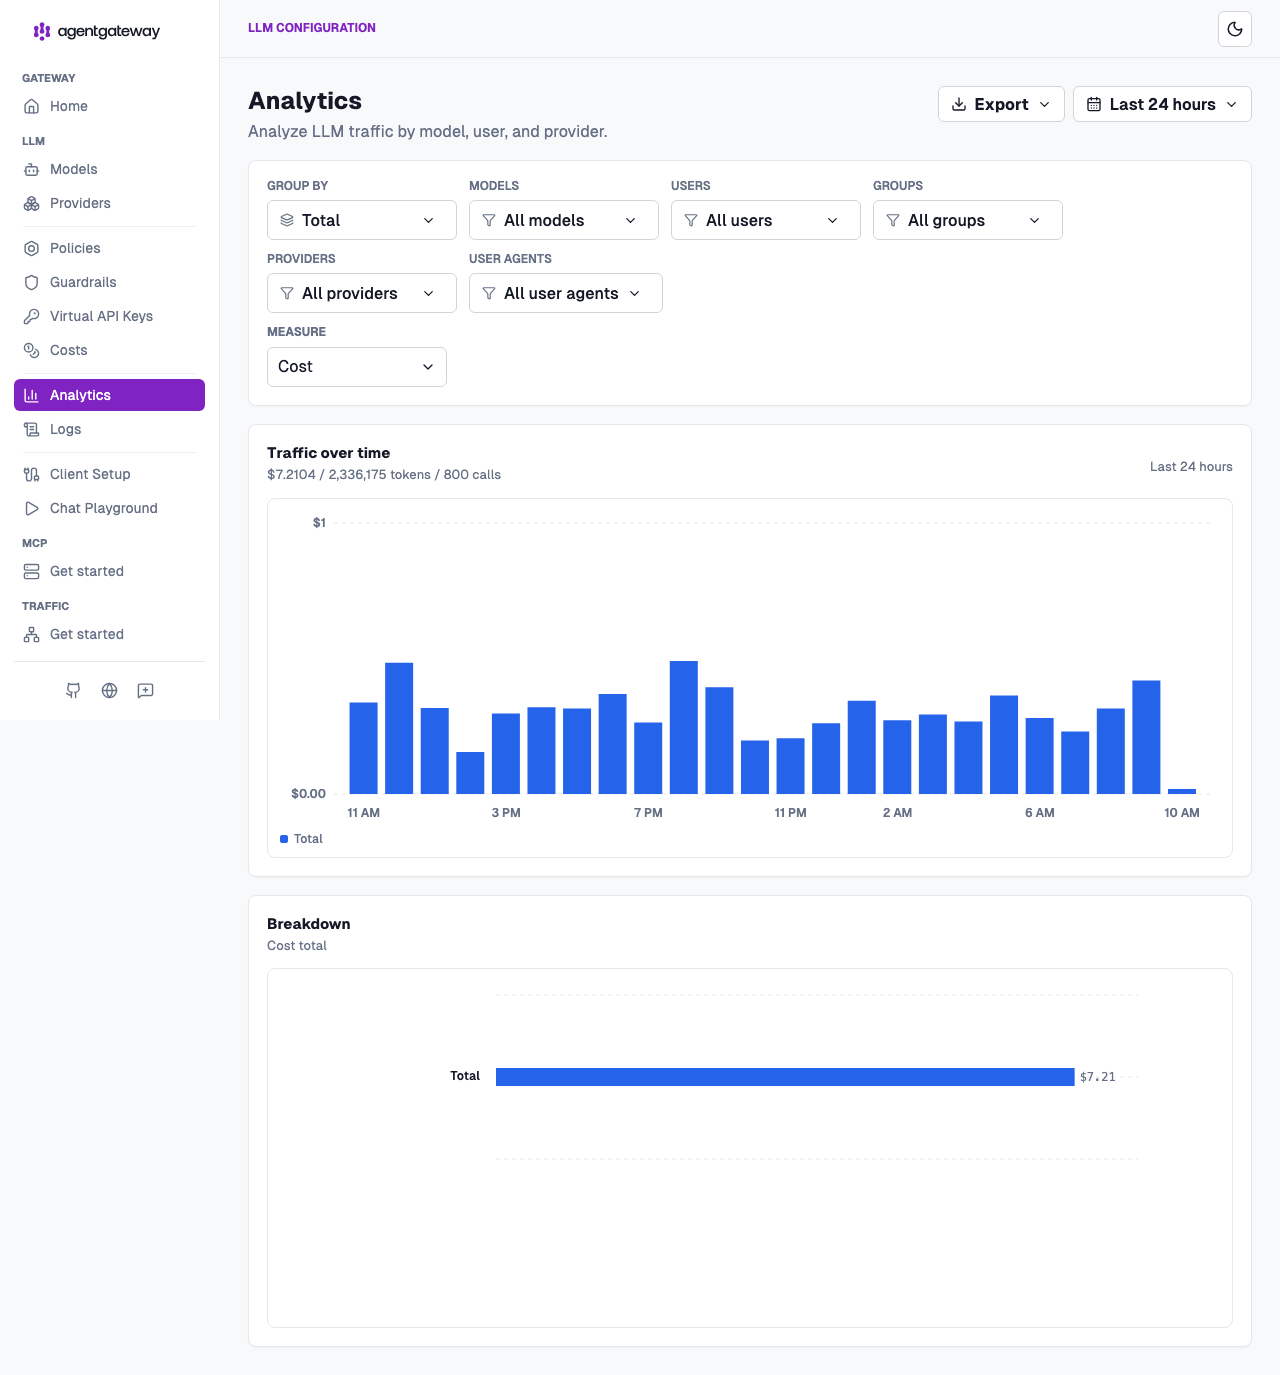
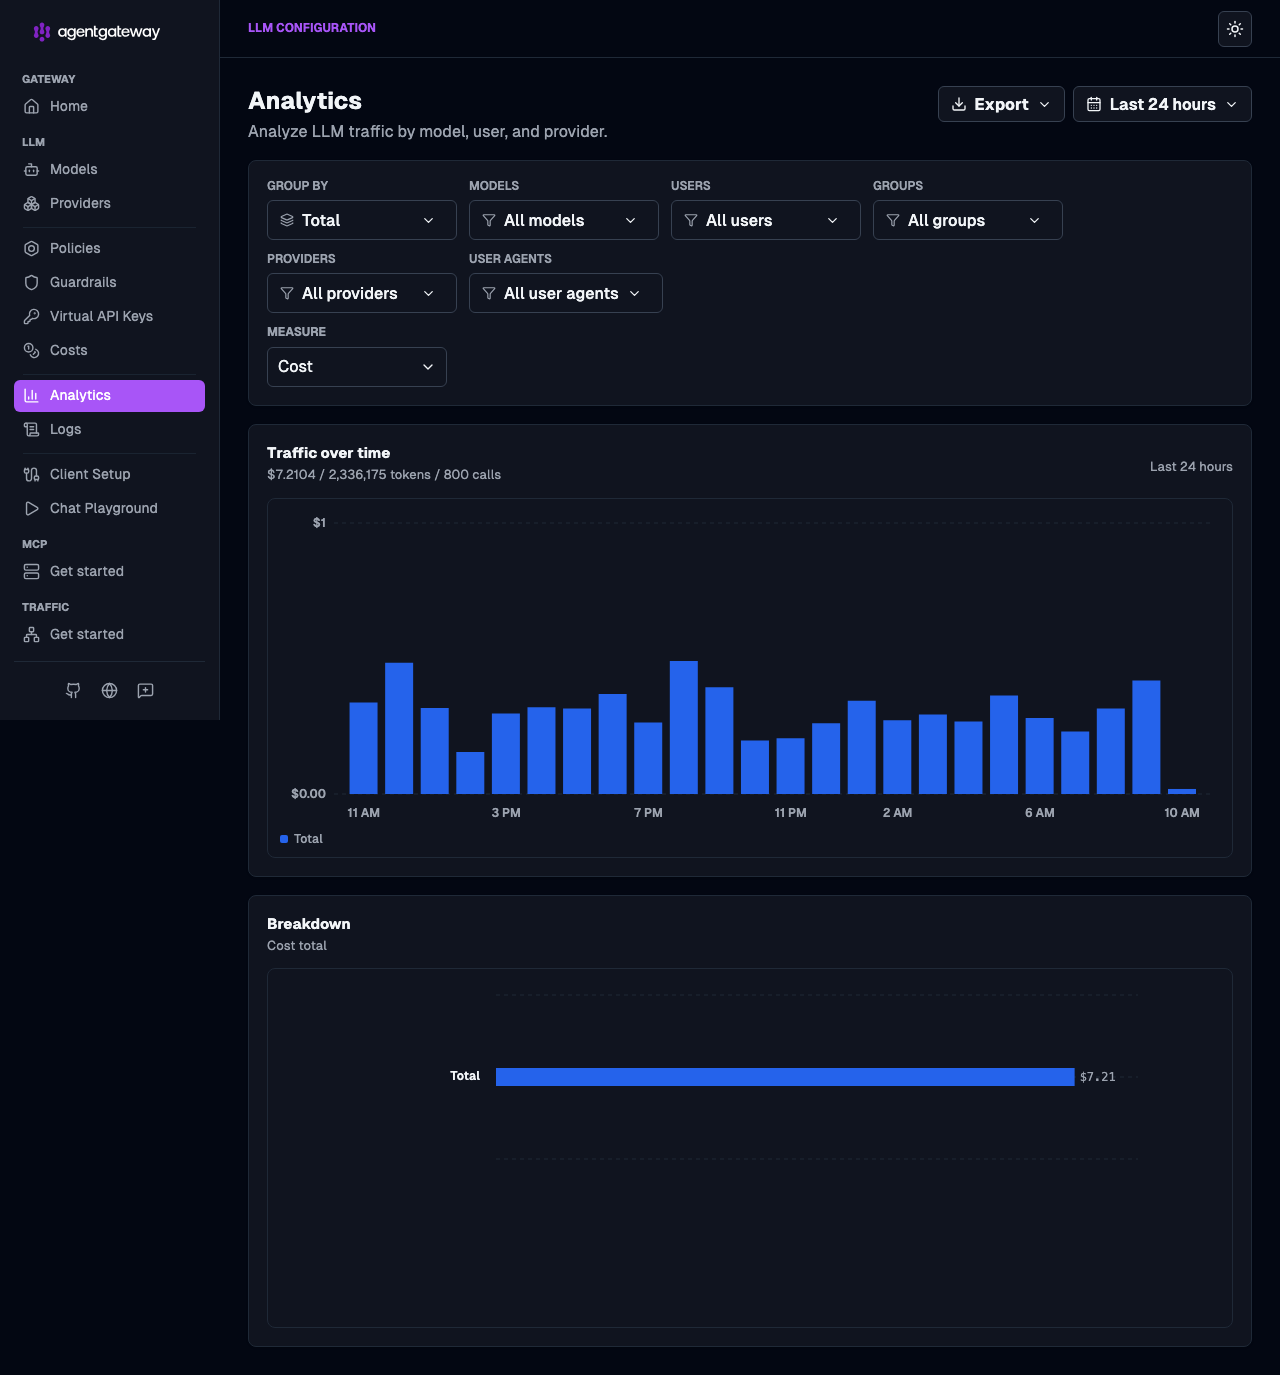
Use Export to pull the underlying numbers out for reporting.
Send traffic and watch it get priced
With the gateway running, send a request that matches a model in your catalog:
curl -s http://localhost:4000/v1/chat/completions \
  -H "Content-Type: application/json" \
  -d '{"model":"gpt-4o-mini","messages":[{"role":"user","content":"Hello from agentgateway!"}]}'
Refresh the Analytics page and the request appears: tokens counted, cost calculated against the catalog, and attributed to the model, provider, and (if present) user. The realized cost is recorded alongside token counts, which is why the same fields you see in logs and metrics also drive the dashboard.
Persistence and scaling
The dashboard reads from the database at config.database.url. Agentgateway supports SQLite (default, single instance) and PostgreSQL. See Request Log for full configuration details, including connection string format, credentials, and schema reference.