For the complete documentation index, see llms.txt. Markdown versions of all docs pages are available by appending .md to any docs URL.
Benchmarking
Explore performance benchmarks, methodology, and reproduction guidance for agentgateway inference routing.
Compare the performance of agentgateway in standalone mode versus a plain Kubernetes Service for inference routing.
In standalone request scheduler mode, agentgateway runs as a sidecar proxy with the Endpoint Picker Extension (EPP) and communicates with it over localhost. This benchmark runs that standalone configuration on Kubernetes, without a full Gateway API stack.
For setup instructions, see the inference benchmark README.
Test environment
This campaignBenchmark campaignA coordinated set of benchmark runs that compares configurations using a defined test environment, workload, and methodology. compares EPP-based agentgateway routing with a plain Kubernetes Service across eight vLLM model servers. The Kubernetes Service baseline uses Service load-balancing, with no EPP or scoring to route inference requests to a model server endpoint.
The optimized-baseline-qwen3-32b-h100-v0.9 reference profile is used for the campaign,
based on llm-d’s Optimized Baseline.
The agentgateway treatmentsBenchmark treatmentA specific configuration evaluated in a benchmark, such as a routing strategy or deployment mode, whose results are compared with a baseline. use approximate prefix-cache affinity and token-load
scoring to select model-server endpoints.
If you are interested in benchmarks for other llm-d well-lit paths or inference topologies, create an issue that explains your use case.
Prefill/decode (P/D) disaggregation is not used. Each vLLM replica handles both prefill and decode. The comparison configuration disables separate prefill replicas and the P/D routing sidecar, so all treatments use the same model-server topology. These results compare routing within that topology, rather than measuring the effects of P/D disaggregation.
The table summarizes the published campaign. See the campaign manifest for configuration details and the campaign provenance for execution times and shared configuration hashes.
| Setting | Value |
|---|---|
| Cluster provider | gke (Google Kubernetes Engine) |
| Accelerator type and model | NVIDIA H100 GPU (gpu, h100) |
| Total accelerators | 16 GPUs (8 replicas × 2 GPUs per replica) |
| Backend type | vllm |
| Model | Qwen/Qwen3-32B |
Note
These are published results for agentgateway v1.4.1, regardless of the docs version selected.
Workload
The workload configuration uses streaming completion requests with the following settings:
- Arrival pattern: Randomized (Poisson).
- Request timeout: 300 seconds.
- Shared-prefix groups: 150 groups with five prompts per group.
- Prompt lengths: 6,000 tokens for the shared system prompt and 1,200 tokens for the user prompt.
- Target output length: 1,000 tokens.
- Multi-turn chat: Disabled.
- Requested rates: 3–60 requests/s across the measured stages, after warm-up.
Results
Peak output throughput is the maximum number of tokens-per-second across the tested request rates. All other summary metrics are at a rate of 60 requests-per-second. See Metric definitions for more detail.
Higher throughput and lower latency are better. A positive percentage indicates an increase, which is favorable for throughput but unfavorable for latency.
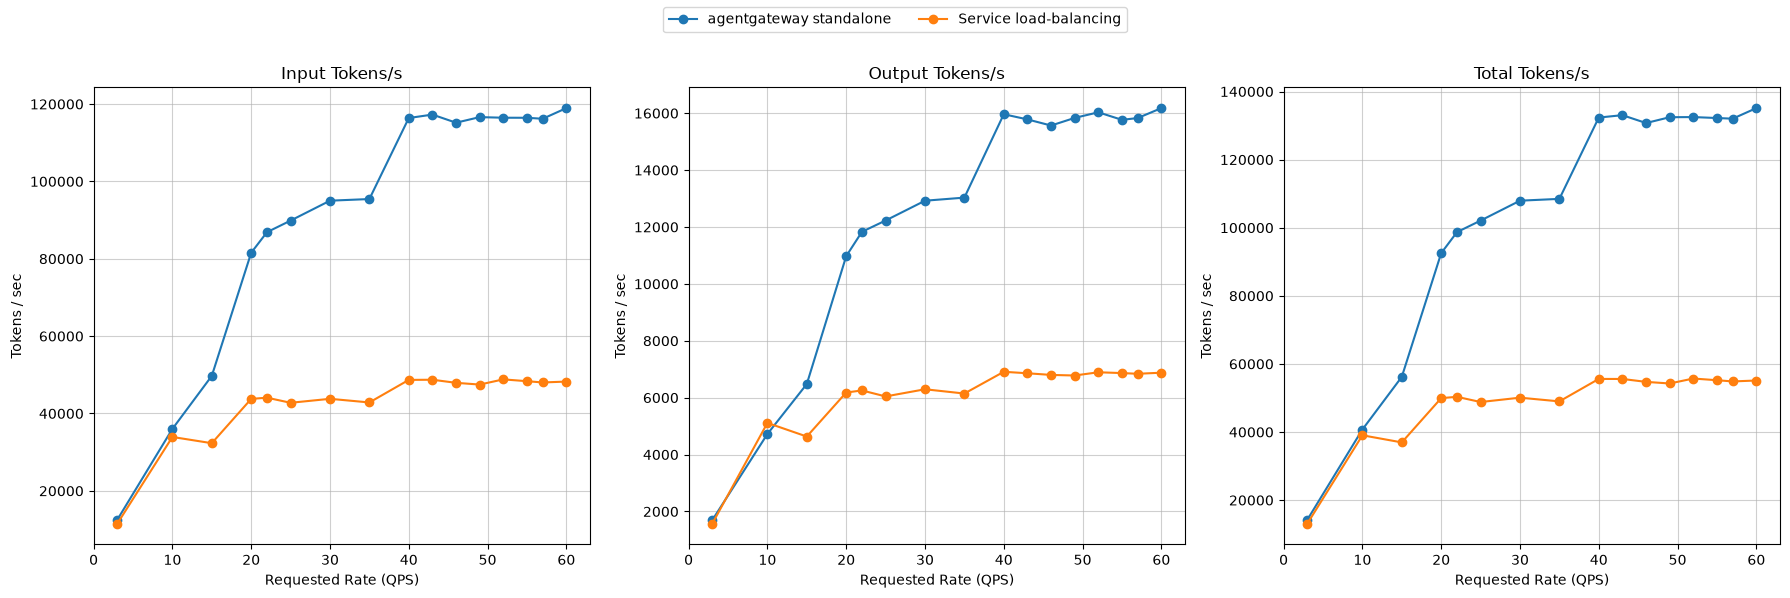
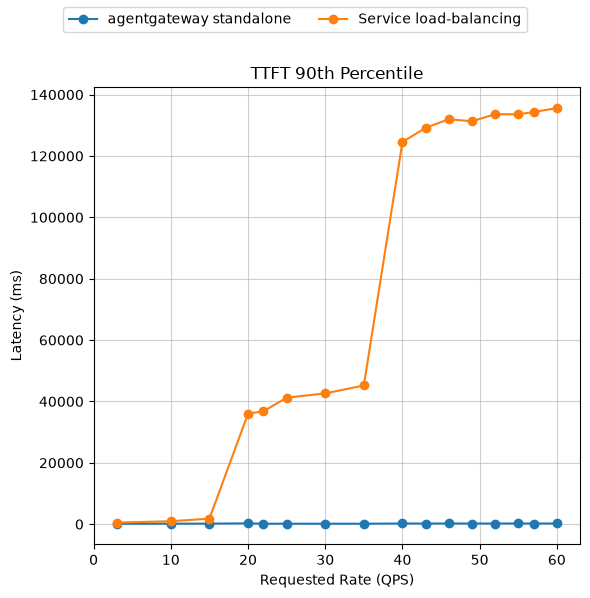
At 10 requests/s, the Service baseline has slightly higher output throughput; both agentgateway modes pull ahead at 15 requests/s, and the baseline’s TTFT rises sharply at 20 requests/s as its throughput begins to plateau. The large TTFT reductions at 60 requests/s therefore describe performance against an overloaded baseline, rather than a uniform improvement across all loads.
| Metric | Kubernetes Service | agentgateway standalone | Change vs. baseline |
|---|---|---|---|
| Peak output tokens/s | 6,910 | 16,178 | +134.1% |
| Achieved requests/s | 6.70 | 16.52 | +146.5% |
| TTFT p50 (s) | 62.9 | 0.1 | −99.8% |
| TTFT p90 (s) | 135.6 | 0.2 | −99.8% |
| ITL p50 (ms) | 30.3 | 52.7 | +73.7% |
Token throughput
The charts show input, output, and total token throughput in tokens per second across the tested request rates.
Mean latency
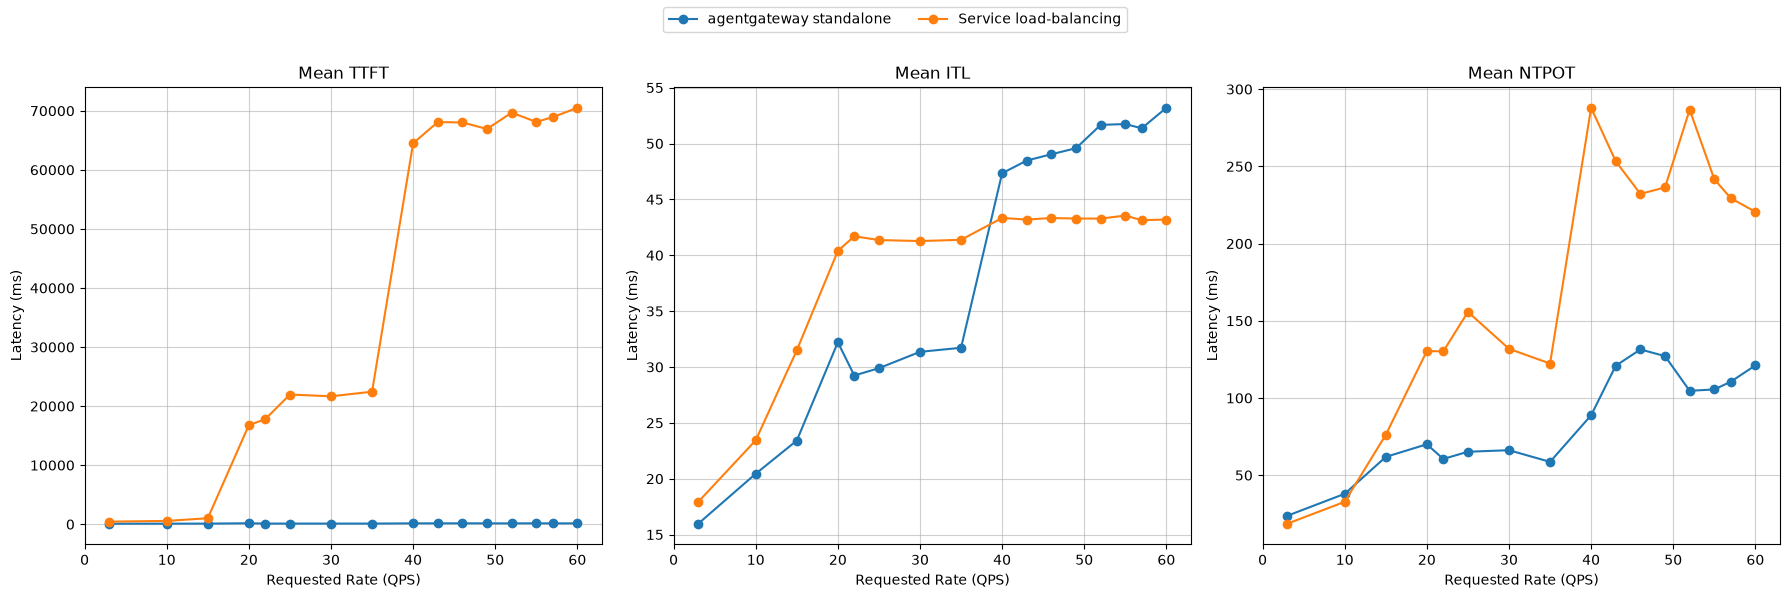
The charts show mean TTFT, ITL, and NTPOT in milliseconds. The summary table reports latency percentiles, with TTFT in seconds and ITL in milliseconds.
Time to first token (p90)
The chart shows p90 TTFT in milliseconds while the tables report it in seconds.
Note
The published metrics record zero failed requests across all measured stages for the Kubernetes Service baseline and both agentgateway modes. Each treatment has only one repetition, so these results do not quantify run-to-run variability.
Per-rate breakdown
Output throughput is in tokens/s (higher is better); TTFT is in seconds (lower is better).
| Requests/s | Kubernetes Service Output | agentgateway standalone Output | Kubernetes Service TTFT p50 | agentgateway standalone TTFT p50 | Kubernetes Service TTFT p90 | agentgateway standalone TTFT p90 |
|---|---|---|---|---|---|---|
| 3 | 1,570 | 1,694 | 0.5 | 0.1 | 0.5 | 0.1 |
| 10 | 5,113 | 4,723 | 0.5 | 0.1 | 1.0 | 0.2 |
| 15 | 4,634 | 6,480 | 0.6 | 0.1 | 1.8 | 0.2 |
| 20 | 6,182 | 10,974 | 2.5 | 0.2 | 36.0 | 0.3 |
| 22 | 6,255 | 11,831 | 3.9 | 0.1 | 36.8 | 0.1 |
| 25 | 6,044 | 12,227 | 6.7 | 0.1 | 41.2 | 0.1 |
| 30 | 6,296 | 12,923 | 7.0 | 0.1 | 42.6 | 0.1 |
| 35 | 6,145 | 13,032 | 7.6 | 0.1 | 45.2 | 0.1 |
| 40 | 6,910 | 15,964 | 78.0 | 0.1 | 124.5 | 0.2 |
| 43 | 6,858 | 15,781 | 80.2 | 0.1 | 129.2 | 0.2 |
| 46 | 6,800 | 15,566 | 65.3 | 0.2 | 132.0 | 0.2 |
| 49 | 6,780 | 15,834 | 55.1 | 0.1 | 131.3 | 0.2 |
| 52 | 6,893 | 16,031 | 72.0 | 0.1 | 133.6 | 0.2 |
| 55 | 6,865 | 15,766 | 56.4 | 0.1 | 133.6 | 0.2 |
| 57 | 6,840 | 15,829 | 55.2 | 0.1 | 134.3 | 0.2 |
| 60 | 6,879 | 16,178 | 62.9 | 0.1 | 135.6 | 0.2 |
Interpreting ITL
At a rate of 60 requests/s, agentgateway has higher p50 ITL (52.7 ms versus 30.3 ms for the Kubernetes Service), but higher throughput and lower time to first token. Read ITL together with TTFT and throughput to assess this tradeoff.
Methodology and metric definitions
Each treatment ran independently with the same workload and model-server topology. The provenance records the execution times and shared configuration hashes. These reports compare each agentgateway deployment mode with the Kubernetes Service baseline.
- Requested rate (QPS) is the load offered by the generator.
- Requests/s is the achieved request throughput, which can be lower under load.
- Output tokens/s measures output throughput; higher is better. The summary reports each treatment’s peak across the tested request rates.
- TTFT (time to first token) includes waiting for the first response token; lower is better. p50 is the median, and p90 is the 90th percentile.
- ITL (inter-token latency) measures token cadence after the first token; lower is better, but it must be considered together with TTFT and throughput.
- NTPOT (normalized time per output token), used in the latency chart, is end-to-end latency divided by output tokens.
Warm-up stages whose requested rate repeats in the measured ladder are excluded.
Evidence and reproduction
The published report,
charts, and tables on this page come from campaign optimized-baseline-v0230-gateway-refresh-20260817.
- Normalized metrics (CSV)
- Campaign manifest
- Campaign provenance
- Benchmark runner and reproduction instructions
Use the campaign manifest’s versions and configuration when reproducing these results.
For the other deployment mode, see the Kubernetes Gateway API benchmarks.