For the complete documentation index, see llms.txt. Markdown versions of all docs pages are available by appending .md to any docs URL.
Datadog
Export agentgateway metrics and LLM traces to Datadog.
Datadog collects metrics and OpenTelemetry traces from agentgateway. Choose the setup that matches what you want to observe.
| Setup | Telemetry | When to use it |
|---|---|---|
| Complete example | Proxy and controller metrics, LLM traces, and a dashboard | Evaluate the integration end to end or use it as a production reference |
| Direct trace export | LLM traces | Add tracing to an existing Kubernetes deployment with the fewest components |
The complete example is the recommended starting point. It uses the Datadog Agent for OpenMetrics collection and an OpenTelemetry Collector for trace processing. The direct setup sends traces from the proxy to the Agent.
Before you begin
For either setup, you need:
- A Kubernetes cluster,
kubectl, and Helm. - A Datadog organization, API key, and the correct Datadog site.
- Agent Observability enabled in your Datadog organization to view LLM traces.
The complete example also uses Docker, Kind, curl, and uv, and needs free loopback ports 13000, 18080, 18520, and 19092 for the smoke test’s port forwards. You can use an
existing cluster instead of Kind.
The direct trace setup applies a policy to an existing agentgateway proxy, so complete the following steps first. The complete example deploys its own proxy and does not need them.
Run the complete example
The Datadog Kubernetes example deploys the agentgateway controller and a controller-provisioned proxy, a synthetic OpenAI-compatible provider, an OpenTelemetry Collector, and the Datadog Agent. It does not call a paid model.
Note
The example pins the agentgateway, Gateway API, and Datadog Agent versions it was tested against, and its OpenTelemetry Collector configuration includes workarounds for that release. Check the example README for the pinned versions before you run it against a newer release.
Clone the agentgateway repository and change to the example directory.
git clone https://github.com/agentgateway/agentgateway.git
cd agentgateway/examples/datadog/kubernetes
Export your Datadog API key and site. The example creates the Kubernetes Secret for you; do not add the key to a manifest.
export DD_API_KEY="replace-with-your-datadog-api-key"
export DD_SITE="us3.datadoghq.com"
Follow the Kubernetes example README to create or select a cluster, install the pinned Datadog Agent and agentgateway versions, and deploy the test resources.
Generate synthetic traffic and verify the local telemetry assertions.
./smoke.shVerify that the Agent discovered the OpenMetrics endpoints for the agentgateway controller and proxy. Counter metrics need successive scrapes before rate samples appear in the Datadog UI.
export DD_AGENT_POD="$(kubectl get pods \
  --namespace datadog \
  --selector app=datadog \
  --output jsonpath='{.items[0].metadata.name}')"

kubectl exec --namespace datadog "${DD_AGENT_POD}" -- \
  agent check openmetrics --check-rate
The output should report healthy instances tagged
component:proxyandcomponent:controller, with metric samples for each endpoint.In Datadog, open Metrics > Explorer, filter by
env:datadog-devandservice:agentgateway, and search for an exact metric name. Narrow the results withcomponent:proxyorcomponent:controller.agentgateway.requests.countagentgateway.gen_ai.token.usage.sumagentgateway.gen_ai.cost.usd.countagentgateway.controller.reconciliations.count
In Dashboards, import the example’s
dashboard.jsonand set theenvtemplate variable todatadog-dev. Enable percentile aggregations in Metrics Summary for the latency distributions before you use the p95 widgets. MCP and guardrail widgets remain empty until their corresponding components or traffic are present.
The example uses a synthetic model that is not in Datadog’s pricing catalog, so
Datadog displays Cost unavailable. The cost calculated from the synthetic
provider’s rates is still in the span’s agw.ai.usage.cost.* attributes and the agentgateway.gen_ai.cost.usd.count metric.
The example collects all proxy and controller metric families. The agentgateway.mcp.requests.count metric’s resource tag can contain tool names
or resource URIs. Review custom-metric usage, tag cardinality, and resource
values before adapting the wildcard configuration for production.
The example provides two alternative ways to annotate a proxy. Use proxy-parameters.yaml for a controller-provisioned proxy. Use proxy-values.yaml only with the standalone proxy Helm chart. Do not apply both
to the same workload.
Configure direct trace export
Use this smaller setup when you only need traces. First install the Datadog Agent with OTLP/gRPC ingestion enabled.
Add the Datadog Helm repository and create the namespace and API key Secret.
helm repo add datadog https://helm.datadoghq.com
helm repo update datadog

kubectl create namespace datadog
kubectl create secret generic datadog-secret \
  --namespace datadog \
  --from-literal=api-key=<your-datadog-api-key>
Install the Agent.
helm install datadog-agent datadog/datadog \
  --namespace datadog \
  --set datadog.apiKeyExistingSecret=datadog-secret \
  --set datadog.otlp.receiver.protocols.grpc.enabled=true \
  --set datadog.otlp.receiver.protocols.grpc.endpoint=0.0.0.0:4317
Create an AgentgatewayPolicy that sends proxy traces to the Agent.
kubectl apply -f- <<EOF_POLICY
apiVersion: agentgateway.dev/v1alpha1
kind: AgentgatewayPolicy
metadata:
  name: tracing
  namespace: agentgateway-system
spec:
  targetRefs:
    - kind: Gateway
      name: agentgateway-proxy
      group: gateway.networking.k8s.io
  frontend:
    tracing:
      backendRef:
        name: datadog-agent
        namespace: datadog
        port: 4317
      protocol: GRPC
      randomSampling: "true"
EOF_POLICY
This direct path does not configure OpenMetrics collection or a dashboard.
Note
Keep API keys out of Kubernetes manifests and source control.
Verify LLM traces in Datadog
Both setups export LLM traces, so verify them the same way.
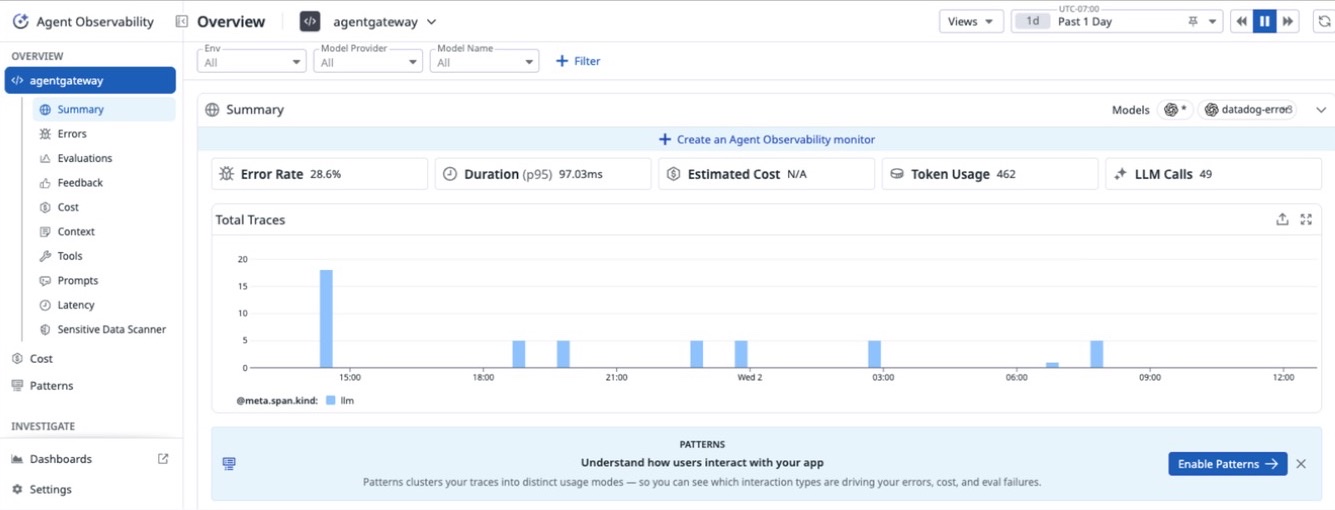
Open AI Observability > Applications and select agentgateway. The summary
shows LLM calls, token usage, duration, errors, and traces for the selected time
range.
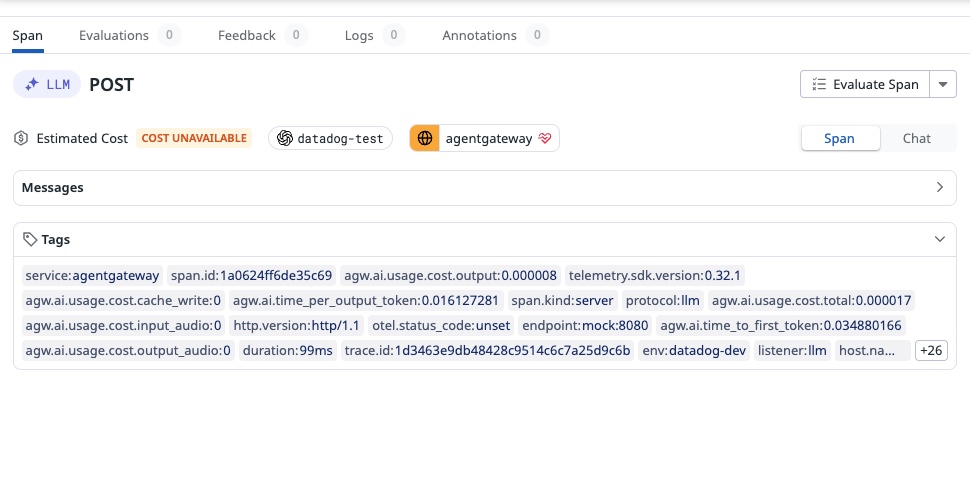
Open AI Observability > Traces and search for ml_app:agentgateway. Inspect
a span to verify its model, token counts, errors, timing, and parent-child trace
relationships. Allow several minutes for processing. A successful OTLP response
or a trace in APM alone does not prove ingestion into Agent Observability.
Troubleshooting
Metrics are missing
A healthy OpenMetrics service check proves that the endpoint responded; it does
not prove that counter samples reached Datadog. Run traffic between scrape
intervals, repeat the check with --check-rate, allow several minutes for
indexing, and confirm that DD_SITE selects the organization that owns the API
key.
Inspect raw proxy metrics directly when you need to distinguish a scrape issue from an agentgateway issue.
kubectl port-forward --namespace agentgateway-system \
  deployment/agentgateway-proxy 18520:15020
curl --fail http://127.0.0.1:18520/metrics
For controller metrics, port-forward service/agentgateway 19092:9092 instead.
Keep management ports private outside troubleshooting.
An OpenMetrics check is missing
Confirm that the Autodiscovery annotation identifier matches the container
name: agentgateway for the proxy and controller for the controller. Do not
scrape the same endpoint through both Autodiscovery and a separate Prometheus
discovery configuration.
Traces are missing
Confirm that Agent Observability is enabled, the Agent is healthy, and the Datadog site is correct. For the complete example, inspect the Collector logs and tracing policy.
kubectl logs --namespace agentgateway-system \
  deployment/datadog-collector --tail 200
kubectl get AgentgatewayPolicy datadog-tracing \
  --namespace agentgateway-system
A successful OTLP response alone does not prove ingestion into Agent Observability.
Cleanup
For the complete example, follow the Kubernetes example README to remove the Kind cluster or the resources installed in an existing cluster.
For the direct trace setup, remove the policy and Agent.
kubectl delete AgentgatewayPolicy tracing \
  -n agentgateway-system
helm uninstall datadog-agent -n datadog
kubectl delete namespace datadog