Provider Rate Limiting is Not Enough for Enterprise LLM Usage
Christian Posta, Michael Levan
Nov 2, 2025
Hosted LLM providers like OpenAI and Anthropic have rate limiting capabilities centered around requests per minute (RPM) and tokens per minute (TPM). These are specified at the “organization” level and “project” level. API keys are associated with an organization or project, and each call is subject to token or rate limit restrictions. The actual limits are set by the provider, not you. They will depend on what tier you pay for, but generally not directly configurable. For example:
| Provider | Model | Typical TPM Limit (per project, tier 1 example) | Notes |
|---|---|---|---|
| OpenAI | GPT-3.5 Turbo | 1,000,000 TPM | Popular mid-tier model |
| OpenAI | GPT-4.1 | 1,000,000 TPM | Advanced, large context window |
| OpenAI | GPT-5 Tier 1 | 500,000 TPM | Raised from 30K TPM recently |
| Anthropic | Claude 3.5 Sonnet | 1,000,000 TPM | Enterprise tier example |
| Anthropic | Claude 3.0 | 400,000 TPM | Lower tier example |
In essence the providers give you coarse grained, non-configurable controls for rate limiting. Enterprises need far more control here. Enterprises need:
- Fine-grained rate limit / quota enforcement
- Detailed report/audit/metrics for chargeback/showback
- Model/provider failover
- Configurable rate limit / metric collection
Providers expect users to figure this out themselves. That’s where something like an LLM gateway (ie, agentgateway) comes into the picture.
In this blog post, you’ll learn how to properly set fine-grained rate limiting, understand cost/usage of Tokens, Model/LLM failover, and observability for agentgateway.
TL;DR video demo
You can see a demo of these features in action here:
What do Enterprises Need?
The hosted LLM providers are trying to protect their service, and rightfully so. They give you fixed buckets for service, and coarse grained limiting that cannot be configured. Enterprises need things like fine-grained rate limit control, attribution metrics, spike arrest, model (and potentially provider) failover, and dashboards/alerting. Most of this should NOT be implemented on the hosted LLM providers (for privacy, PII, and compliance reasons - e.g., sending user IDs, auth context, entitlements, etc), so enterprises are leveraging AI / LLM gateways to do this.
Think of this like cloud providers. You’re essentially “renting infrastructure” from them, and there is a cap/quota/limit that each region has. The same type of concept applies to LLM providers.
Let’s see how agentgateway can be used here.
Fine Grained Rate Limiting, Cost Control, Spike Arrest
Agentgateway can perform rate limiting based on “requests” or “tokens” just like you see from the providers. The time window is configurable, unlike with the providers. You can specify your rate limiting window in terms of seconds, minutes, hours, days, etc.
The key to getting “fine-grained” rate limit is in how agentgateway applies these limits. It can do so on a local or global basis. For example, if we configure rate limits locally with the following:
policies:
  localRateLimit:
    - maxTokens: 1000
    tokensPerFill: 1000
    fillInterval: 1s
    type: tokens
… then each instance of agentgateway will allow 1000 tokens per second. But since we can configure the tokensPerFill we can get sophisticated enough to implement a spike arrest / moving window for our rate limit. For example:
policies:
  localRateLimit:
    - maxTokens: 1000
    tokensPerFill: 100
    fillInterval: 6s
    type: tokens
With this configuration, we could receive a spike of 1000 tokens at any point during our time window but we would refill the rate limit bucket with 100 tokens every 6s. If we had a consistent usage of around 16 tokens per second (100/6) we would never trigger the rate limit. If we get bursts, ie, we could handle them up to a point (ie, 1000 tokens). This type of rate limiting can be applied at the route + matcher level. For example, you can have different rate limit policies on /team-a/openai vs /team-b/openai.
We can also configure a global rate limit policy that would affect all instances of agentgateway. We would need to introduce a rate limit service that uses something like Redis to store its counters. We would then configure the global rate limiter like this on agentgateway:
policies:
  remoteRateLimit:
    domain: "agentgateway"
    host: "${RATELIMIT_HOST:-localhost}:8081"
    descriptors:
    - entries:
        - key: "route"
          value: '"anthropic"'
        type: "tokens"
Global rate limiting works by sending “descriptors” to a rate limiting service. You can think of these descriptors as tags, or metadata about the request that will be used to match on in the rate limit service. For example, in the above, we send a single descriptor called “route” with a value of “anthropic”. We also specify to the rate limit service that this is of type “tokens”.
In the rate limit server, we can configure something like this:
  - key: route
    value: "anthropic"
    rate_limit:
      unit: minute
      requests_per_unit: 5000
What this config does is match on the set of descriptors (in this case, “route” and the value of “anthropic), specify the time window (minute) and the # of requests/tokens per time window. In this case, we’d get 5k tokens per minute for the anthropic route. But like I said, the time window is completely configurable.
This descriptor / matcher is very powerful. We can have hierarchy, match on specific users, IP addresses, organization roles, entitlements, environments, clouds, etc etc. Here’s a more sophisticated configuration:
policies:
  remoteRateLimit:
    domain: "agentgateway"
    host: "${RATELIMIT_HOST:-localhost}:8081"
    descriptors:
      - entries:
          - key: "route"
            value: '"anthropic"'
        type: "tokens"
      - entries:
          - key: "user_id"
            value: 'jwt.sub'
        type: "tokens"
      - entries:
          - key: "remote_address"
            value: 'string(source.address)'
        type: "tokens"
This will enforce rate limit per route/user/source_ip tuple. This gives extremely fine-grained control over how to administer rate limiting. This can then be used to control LLM spend.
Enriching Call Metrics
Once we have fine-grained control over what clients, applications, users, teams, environments, etc can call which models, and enforce fine-grained usage limits at runtime, we need to track what is actually getting used. Model providers do give some visibility into what gets consumed, but again, the buckets are too coarse grained. The usage limits are tracked per project and per API key. Just like with rate limiting, we’ll need more fine-grained metrics.
Organizations are beginning to think about Agentic Infrastructure like they have been thinking about cloud environments for years utilizing failover, High Availability, Usage (in this case, Tokens), and network connectivity. Because of that, understanding what is going on underneath the hood is crucial for all teams utilizing LLMs.
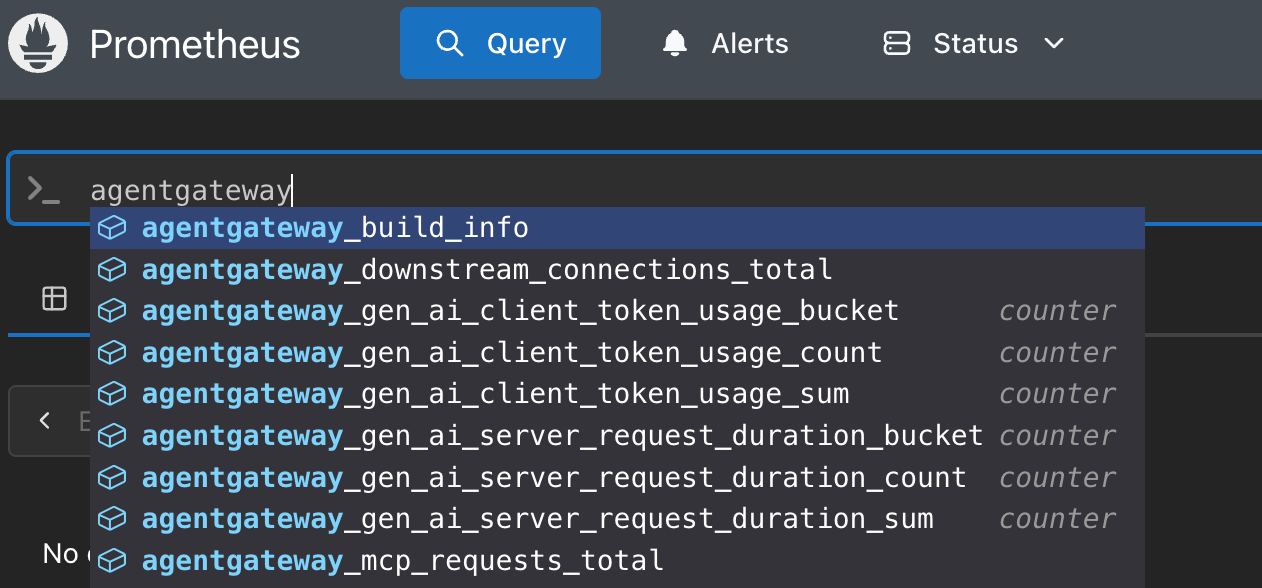
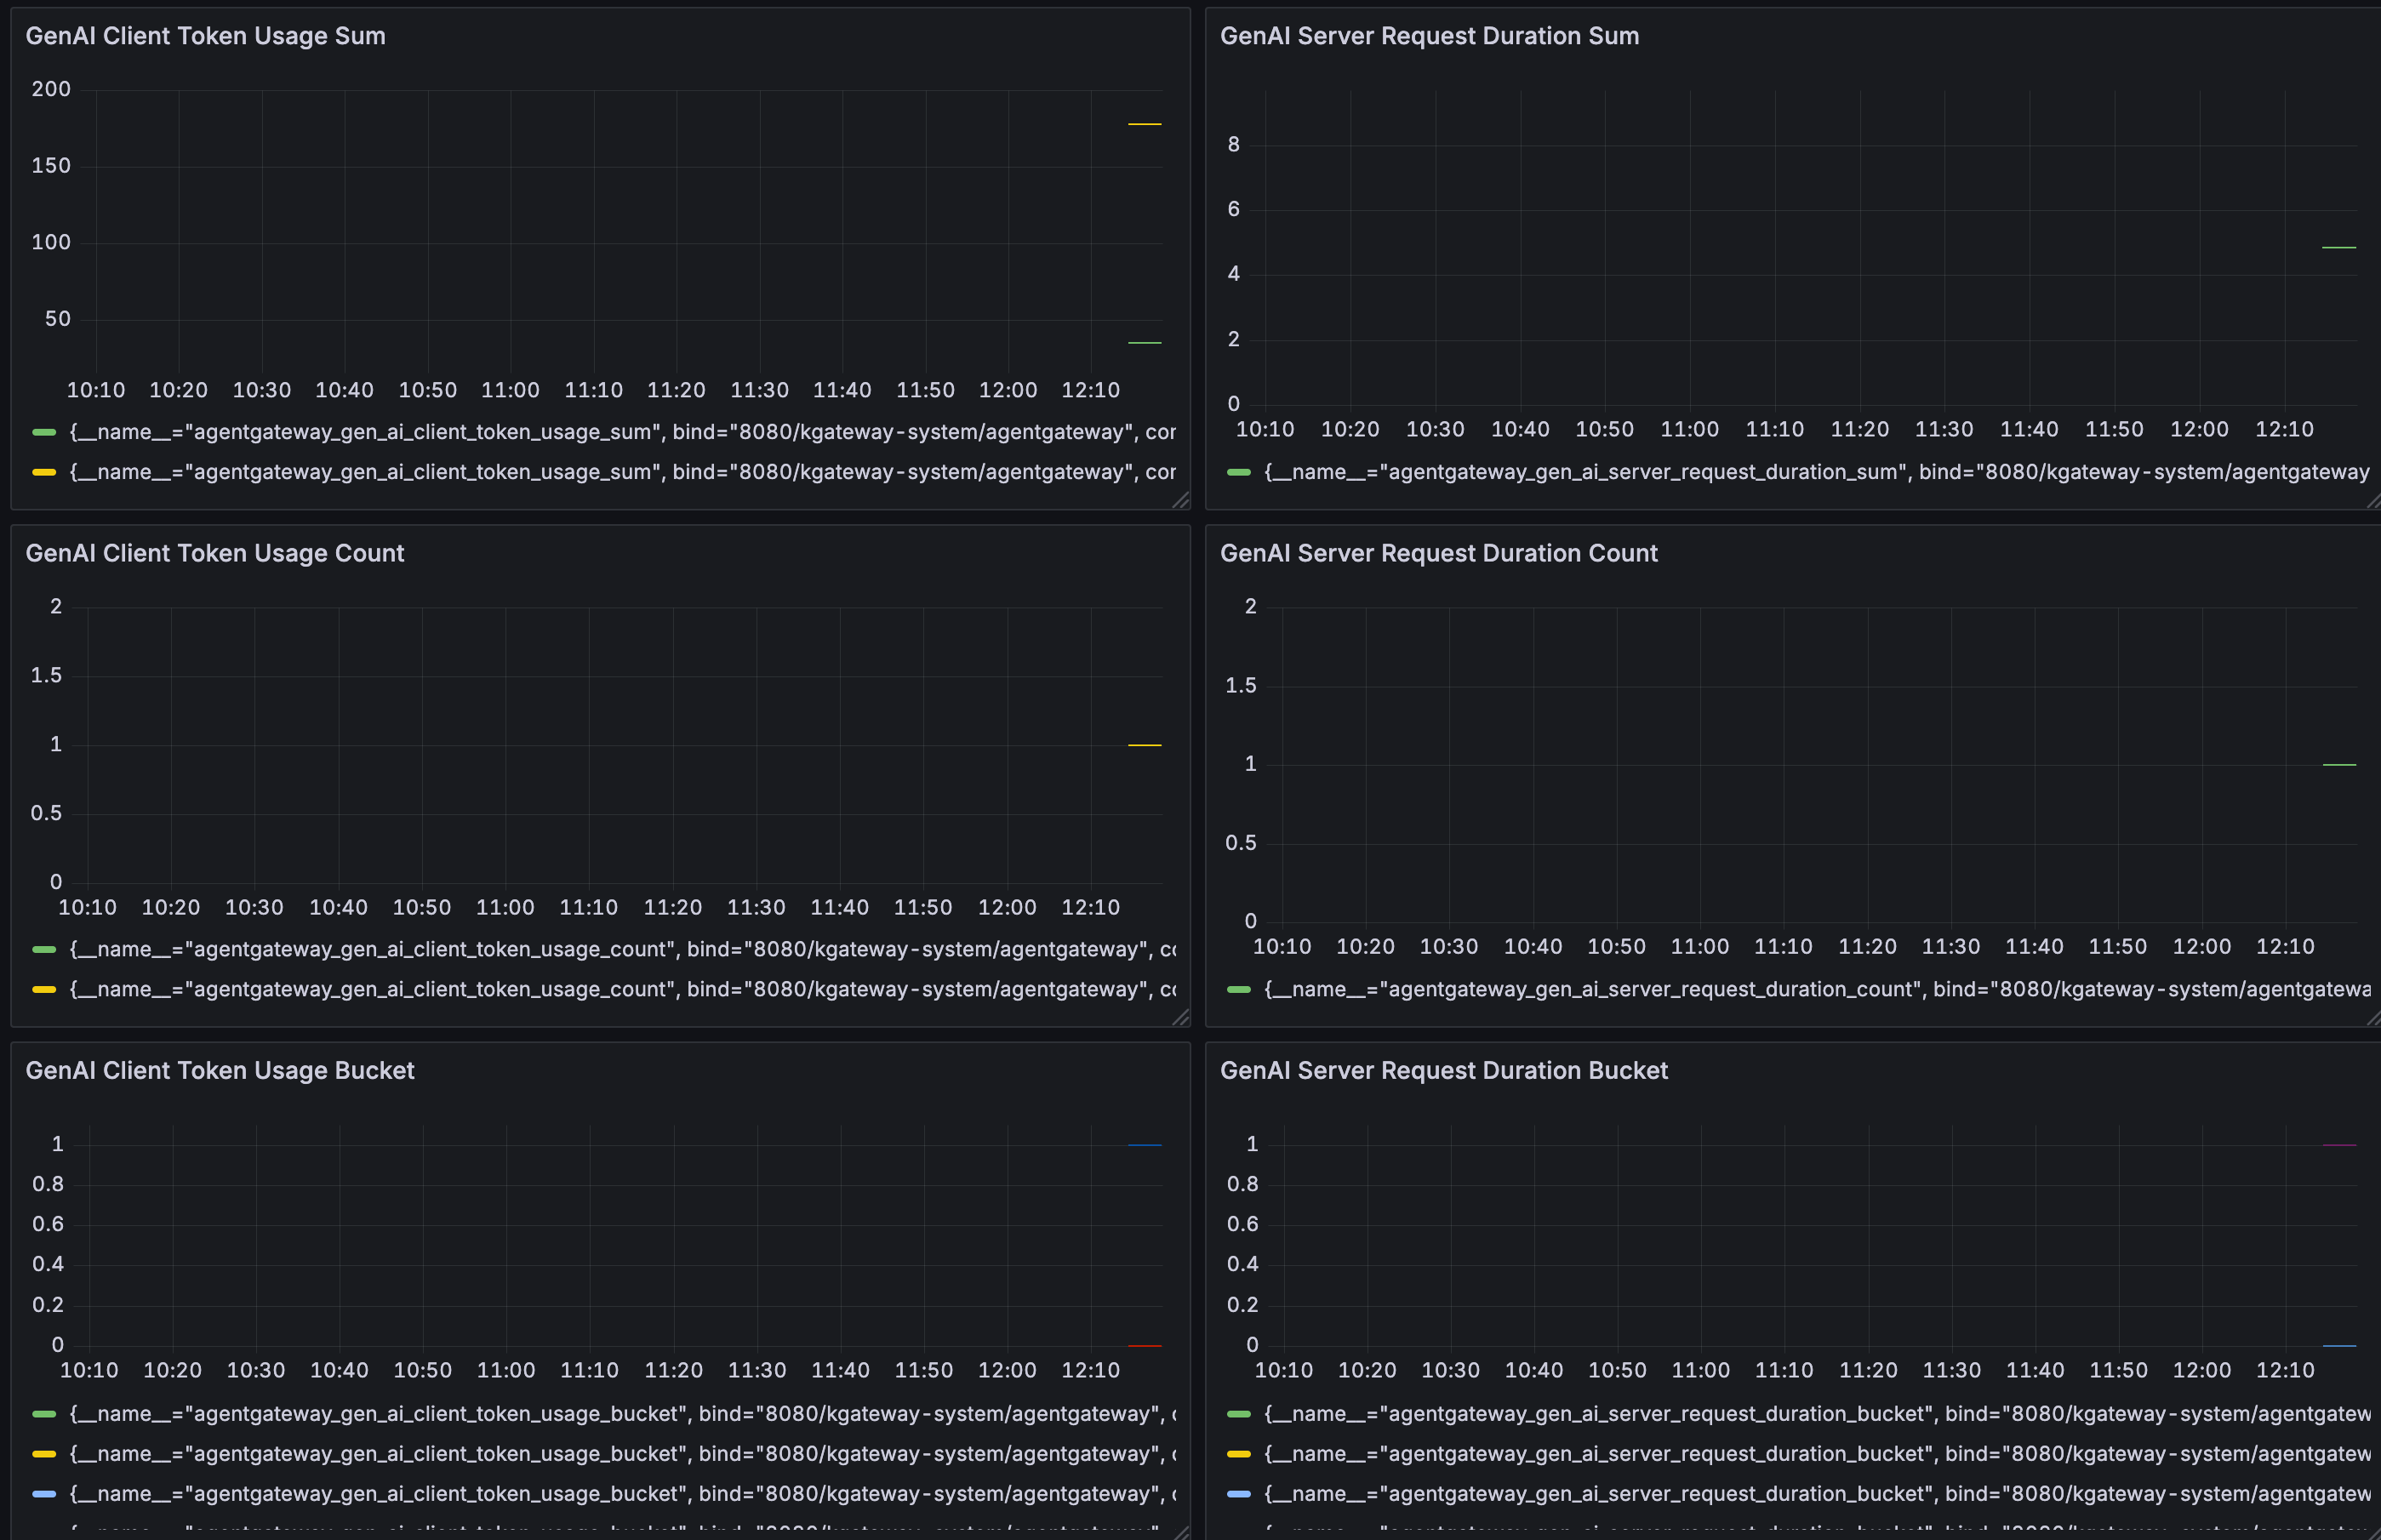
Agentgateway has a wealth of metrics about LLM usage. The important point here is that the metric dimensions are fully configurable. Let’s take a look. Here are the main metrics that get tracked:
- agentgateway_gen_ai_client_token_usage - Tracks the number of tokens used per request to the LLM. Understanding cost and request size distribution.
Example question it answers: “How many tokens are being sent or generated per LLM call?”
- agentgateway_gen_ai_server_request_duration - Measures total duration of each generative AI request on the server side. Observing total latency per LLM request (including input processing + generation).
Example question it answers: “How long does an entire LLM call take end-to-end?”
- *agentgateway_gen_ai_server_time_to_first_token - Time from when the request starts until the model produces the first output token. Use for Tracking model responsiveness.
Example question it answers: “How fast does the model start responding?”
- agentgateway_gen_ai_server_time_per_output_token - Average time it takes the model to generate each token after the first. Use for: Monitoring generation throughput.
Example question it answers: “How fast is the model generating tokens once it starts?”
- agentgateway_gen_ai_client_token_usage_sum - Total Tokens
Example question it answers: “How many tokens have been used for a particular LLM?”
- agentgateway_downstream_connections_total - Counter of downstream connections (labeled by bind, gateway, listener, protocol)
Example question it answers: “What connections are coming from clients to the Gateway?”
If we annotate the metrics with additional metadata, we can get more depth to what calls are happening, by whom, and how to attribute them: Let’s look at an example:
# HELP agentgateway_gen_ai_client_token_usage Number of tokens used per request.
# TYPE agentgateway_gen_ai_client_token_usage histogram
agentgateway_gen_ai_client_token_usage_bucket{
    model="gpt-4-turbo",
    user_id="auth0|68f7a9cc8fabe01218ebfd58",
    user_email="[email protected]",
    team="docs-ai",
    app="knowledge-bot",
    env="prod",
    le="1000"}  58
agentgateway_gen_ai_client_token_usage_bucket{... le="5000"}  72
agentgateway_gen_ai_client_token_usage_sum{...}  168421
agentgateway_gen_ai_client_token_usage_count{...}  93
In this example, Jane from the Docs-AI team used 168K tokens across 93 requests to gpt-4-turbo. By enriching with JWT claims (user_id, team, app, env), you can easily break down token consumption per app, per user, or per environment, giving finance and ops teams visibility into real costs.
Model Failover
While rate limit and attribution makes up a big part of the usage use cases in enterprises to ensure fairness, accounting, and attribution, one aspect that should not get overlooked. Usage is still beholden to the LLM provider and those will have their own usage limits and uptime guarantees. When those limits get exhausted (ie, you hit provider rate limiting / exhaustion of quota) or a particular model has an issue, or the entire provider has out outage, we can’t just sit dead in the water.
Enterprises will need to effectively plan for failover. If traffic is managed through agentgateway, we can explicitly specify failover rules / degradation paths. For example in the following route, we can explicitly plan to failover from gpt-5 to gpt-4o:
- name: failover-openai
  matches:
  - path:
      pathPrefix: /failover/openai
  policies:
    retry:
      attempts: 2        # Retry once (2 total attempts)
      codes: [429]       # Retry on 429 errors
    urlRewrite:
      path:
        prefix: ""
  backends:
  - ai:
      groups:
      - providers:
          - name: primary-model
            provider:
              openAI:
                model: "gpt-5"
            backendAuth:
              key: ${OPENAI_API_KEY}

      - providers:
          - name: secondary-model
            provider:
              openAI:
                model: "gpt-4o"
            backendAuth:
              key: ${OPENAI_API_KEY}
In this case, if gpt-5 has issues or hits provider limits, agentgateway will recognize this (ie, 429s, etc) and failover to the gpt-4o model.
Taking the same approach, there are times where quotas may be hit on a particular AI vendor for the subscription that your organization has or a particular LLM provider is having connectivity issues and failures are occurring. If that happens, you can failover to a different model provider.
  backends:
  - ai:
      groups:
      - providers:
          - name: primary-model
            provider:
              openAI:
                model: "gpt-5"
            backendAuth:
              key: ${OPENAI_API_KEY}

      # Different provider : Anthropic
      - providers:
          - name: secondary-model
            provider:
              openAI:
                model: "claude-3-5-haiku-latest"
            backendAuth:
              key: ${ANTHROPIC_API_KEY}
It’s important to understand the performance and behavior of the primary model and how/what to failover to. Models each have their nuances when it comes to thinking, tool behavior, accuracy, etc. Some thought needs to be put into failover.
Dashboards / Alerting
With the deep insight and usage metrics from agentgateway (and logging, tracing, etc), we can get detailed dashboards across model usage, cost, latency, and reliability. Because every metric can be annotated with rich metadata — such as user_id, team, application, environment, provider, and model — the resulting dashboards become multidimensional and extremely actionable.
Using a standard Prometheus + Grafana setup (or OpenTelemetry-compatible backend like Datadog, New Relic, etc), enterprises can create visualizations such as:
Usage by Model and Team – Track which models are most heavily used by which teams, and correlate this with cost and output quality.
Token Consumption per Environment / App – See how production vs staging traffic differs in request size and token generation, helping optimize cost and detect runaway workloads.
Latency and Time-to-First-Token Trends – Detect degradations or regressions in model responsiveness across providers.
Rate Limit & Throttling Events – Monitor where clients are being throttled, by what route or policy, to proactively tune quotas.
Failover Behavior – Visualize when and why traffic was shifted to a secondary provider or model, surfacing patterns like repeated rate-limit failures or upstream outages.
These dashboards can easily be sliced and diced by any metric dimension you’ve annotated in agentgateway — for example, breaking down token usage by team, application, or region.
For alerting, since all metrics are exposed in standard formats, you can define rules like:
- Trigger alerts when token usage nears a quota threshold per team.
- Notify on sustained latency spikes or slow time-to-first-token.
- Alert when failover events exceed a certain frequency.
- Send cost threshold alerts by model or provider to finance or platform teams.
The combination of agentgateway’s flexible metrics model, Prometheus exposition, and configurable metadata enables both deep operational visibility and automated guardrails. Enterprises can make informed scaling decisions, attribute costs accurately, and quickly detect abnormal behavior across teams, environments, and providers — all without exposing sensitive user data to the hosted LLM providers.
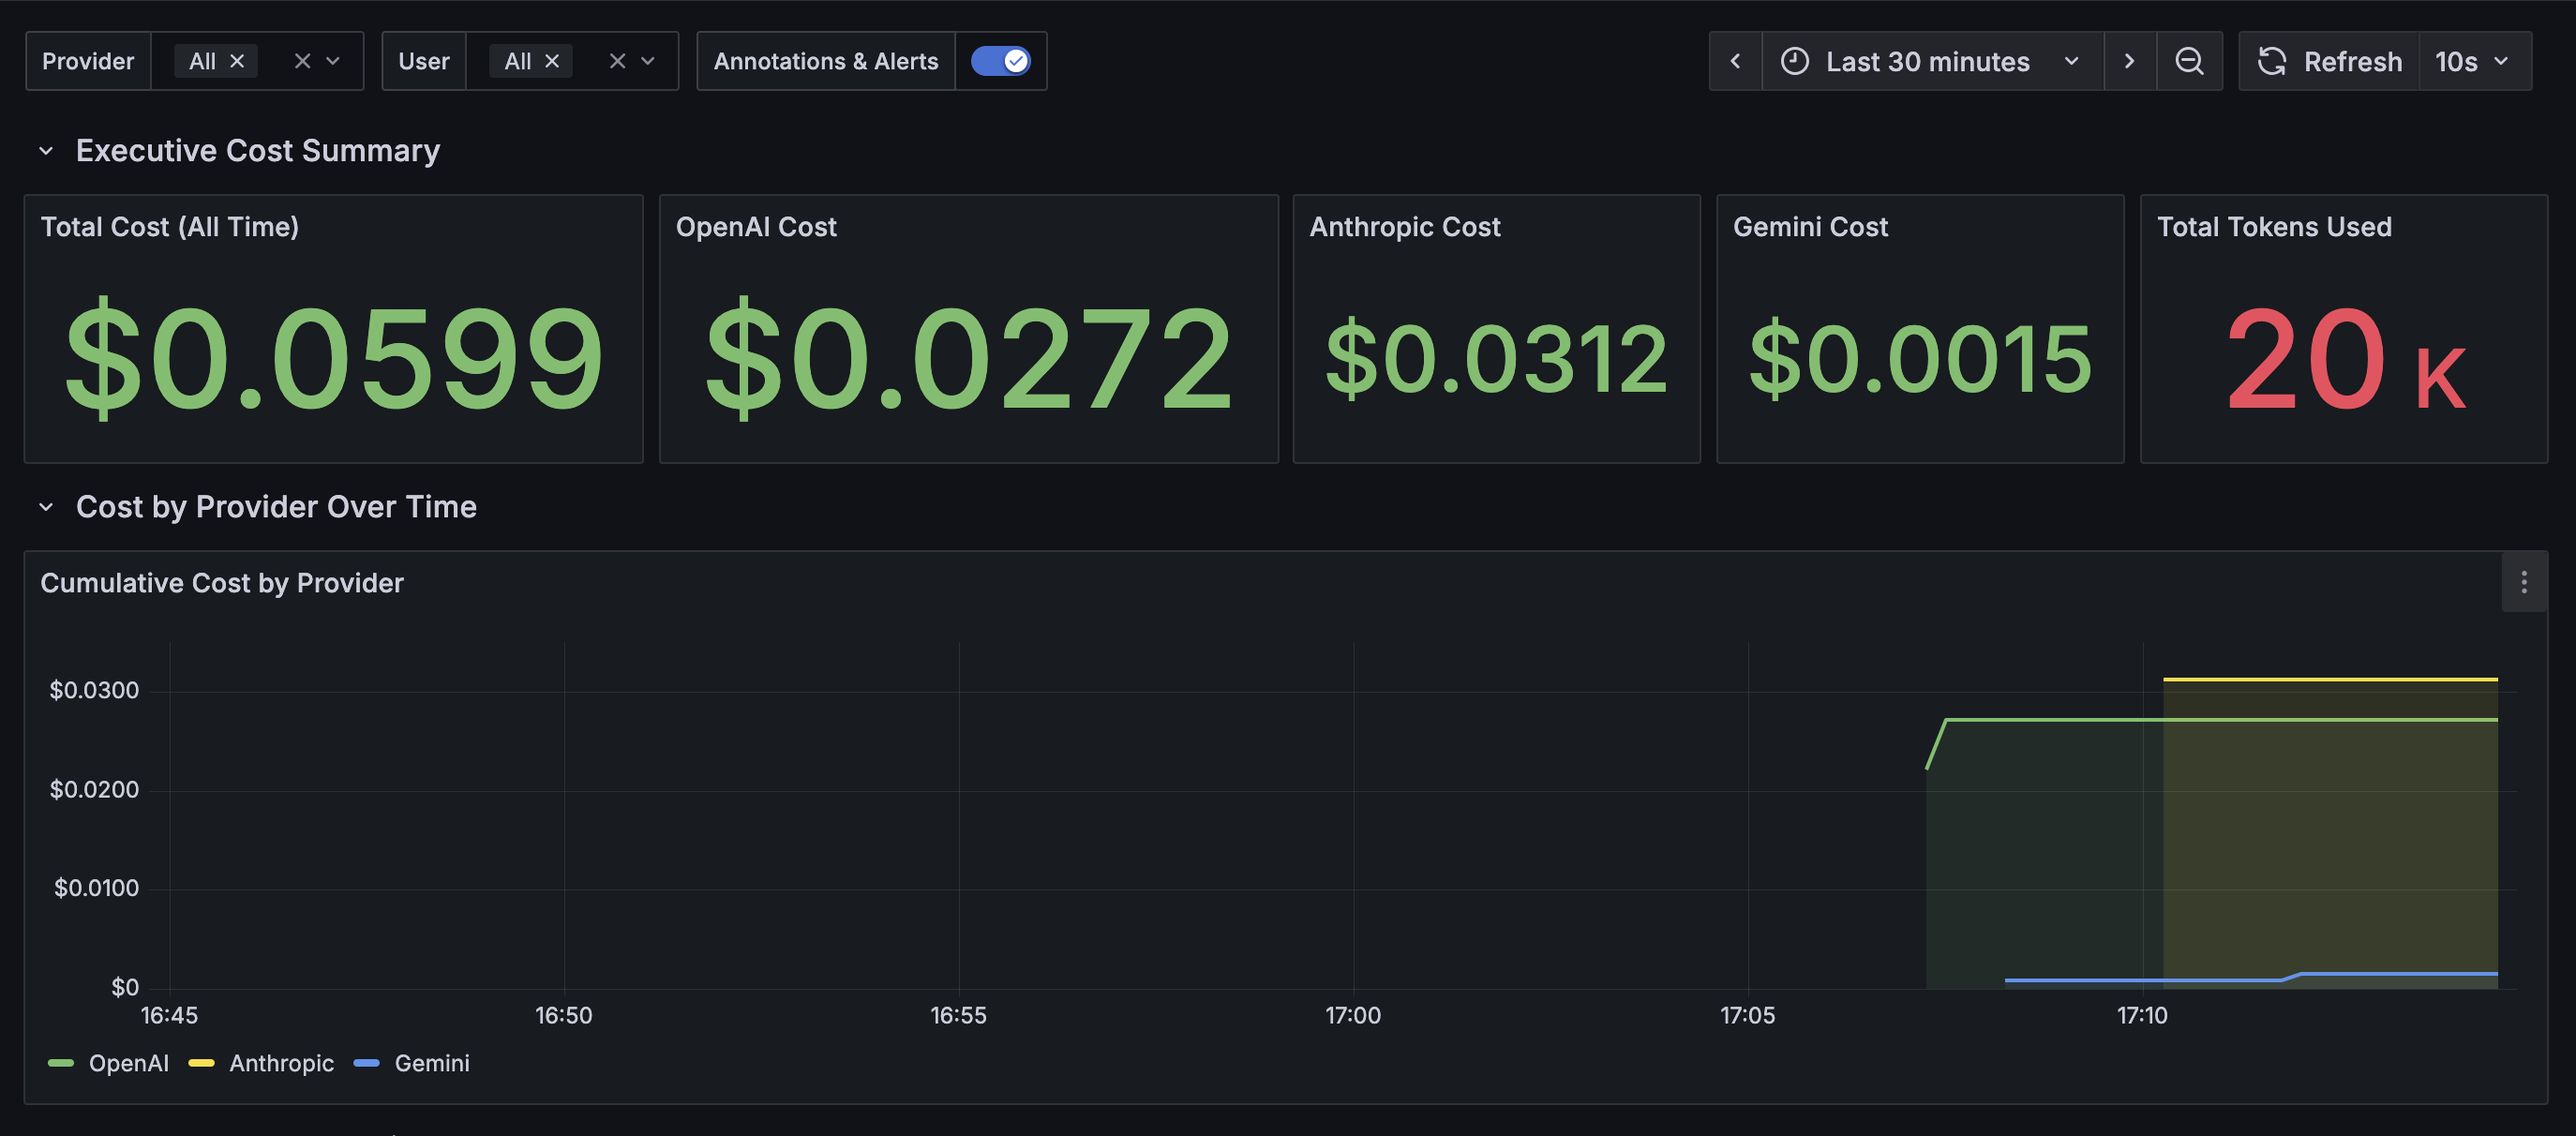
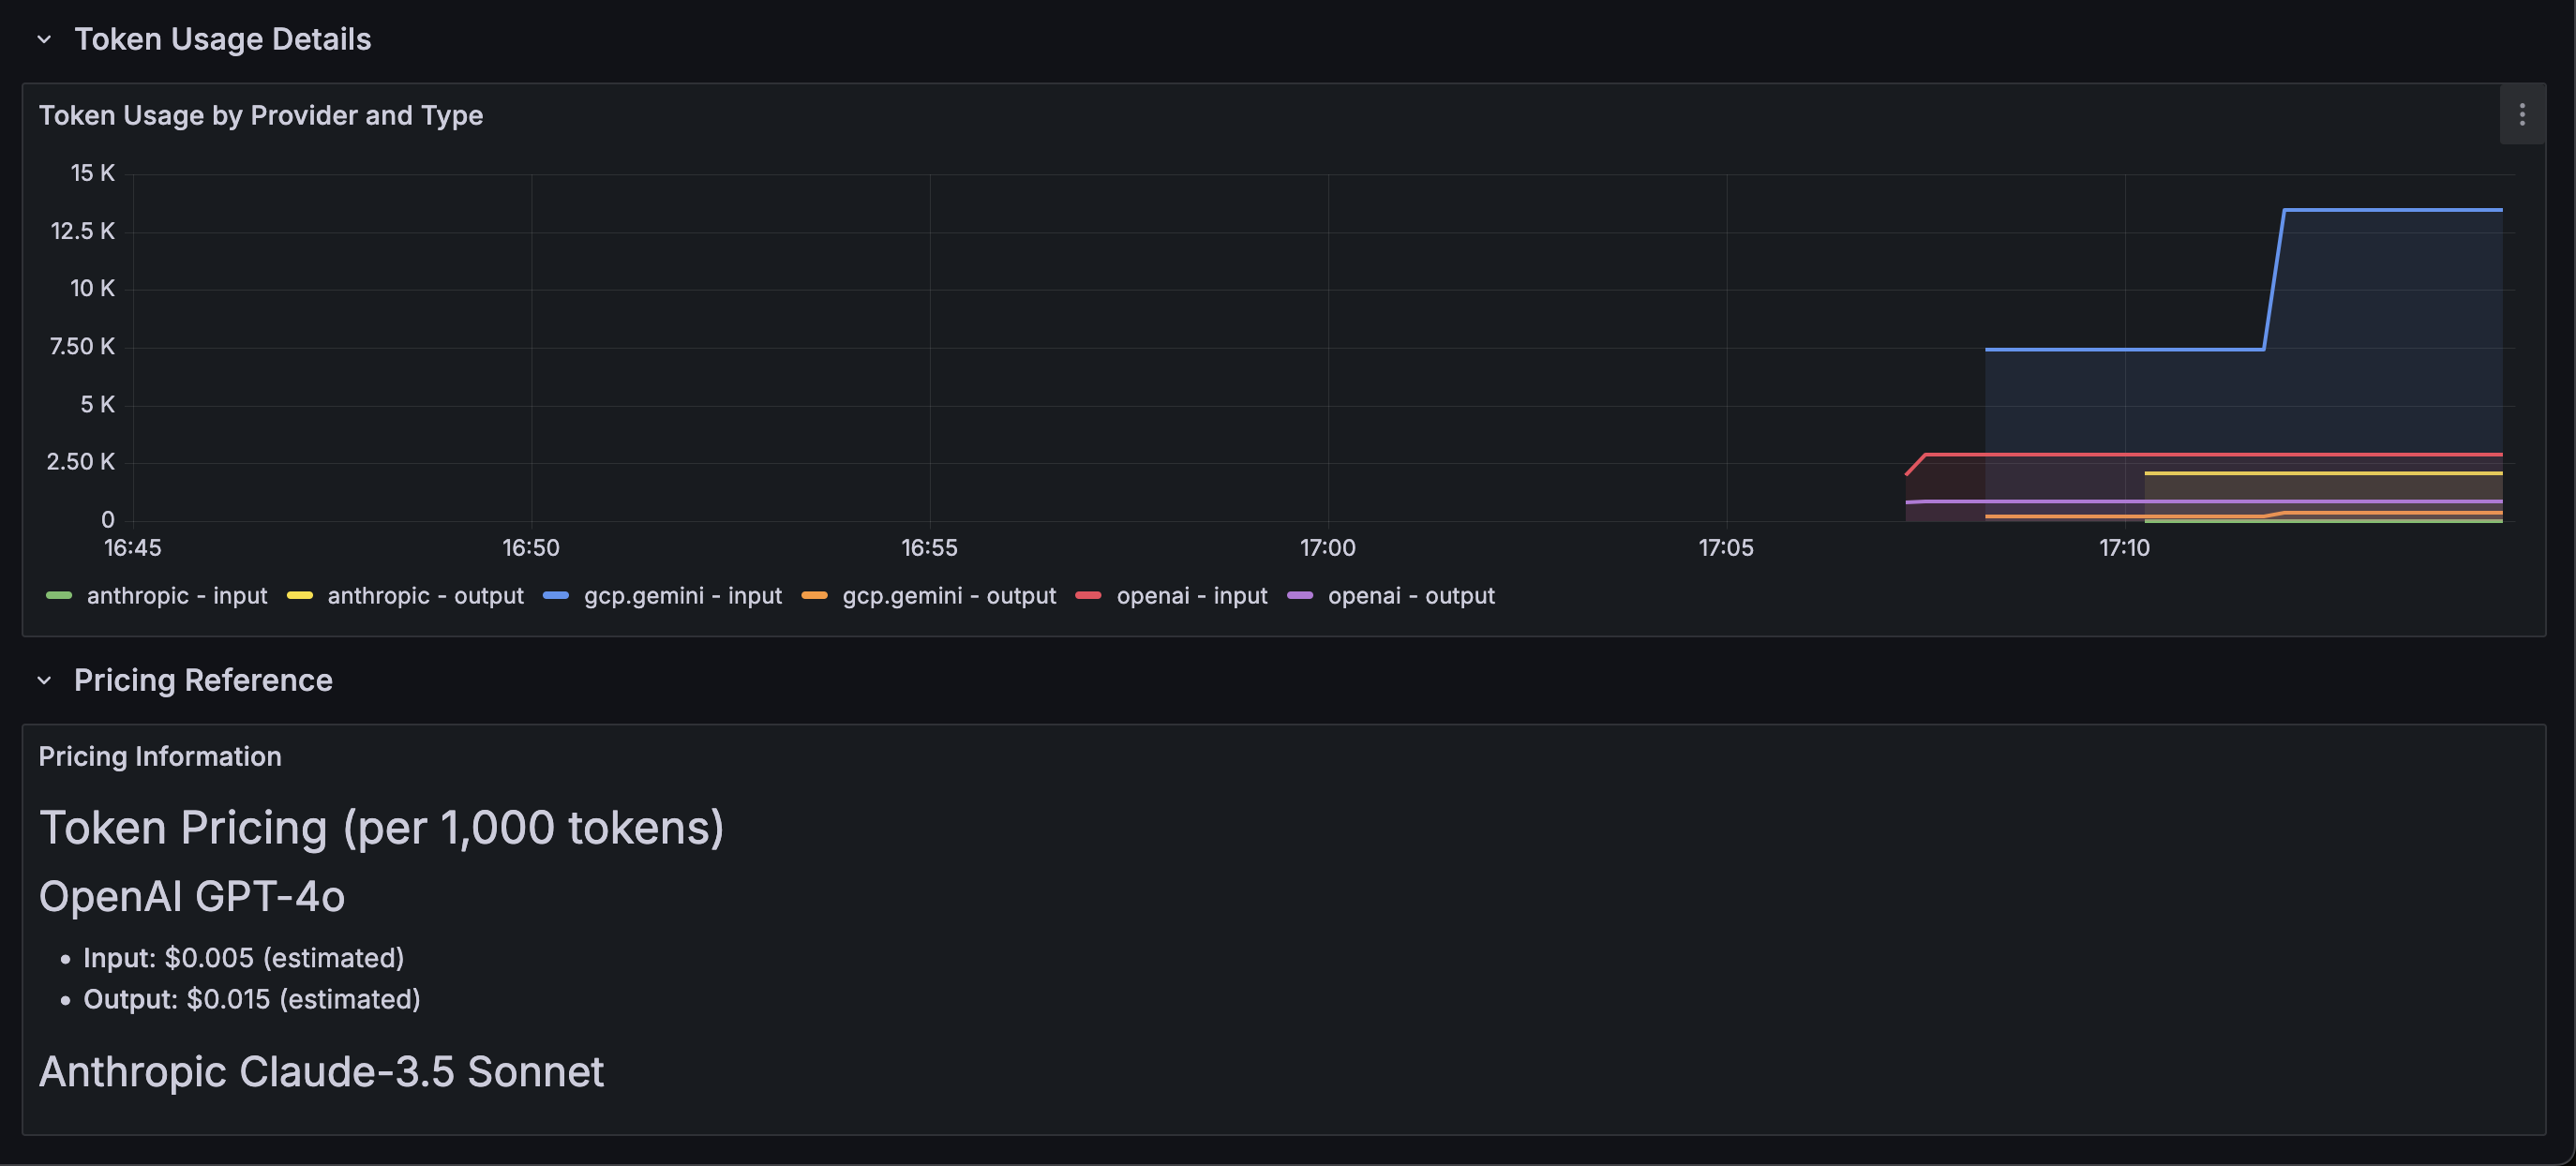
Leaning into Grafana and Prometheus, two popular and prominent open-source monitoring and metrics tools, you can capture the agentgateway metrics within Prometheus and if you want a visual from a monitoring perspective, you can create a Grafana dashboard with those metrics.
You can see the dasboard here
Here’s an example of what the metrics look like from a visual perspective.
Wrapping Up
Enterprises know that managing LLM usage isn’t just about calling an API or relying fully on what the provider has. It’s about governance, control, visibility, and resilience. Agentgateway gives you the building blocks to do this: fine-grained rate limiting, attribution, failover, and metrics/dashboards based on Open Telemetry all without sending sensitive context to hosted LLM providers. If you’re building AI into your enterprise applications, it’s time to treat your LLM traffic like any other critical service layer. Try agentgateway today and see how easy it is to gain control, insight, and reliability over your AI infrastructure.